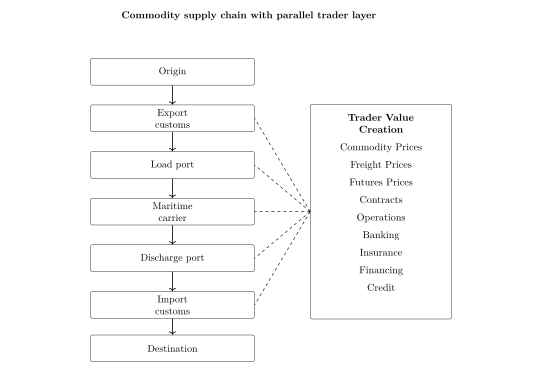
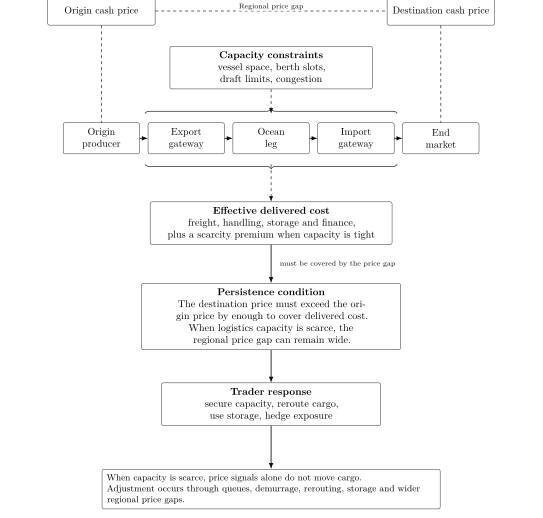
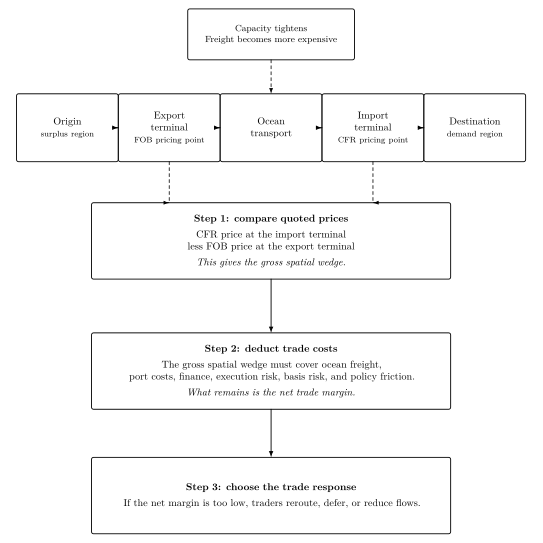
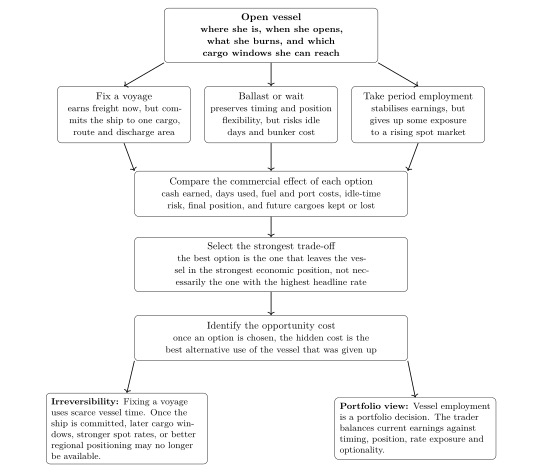
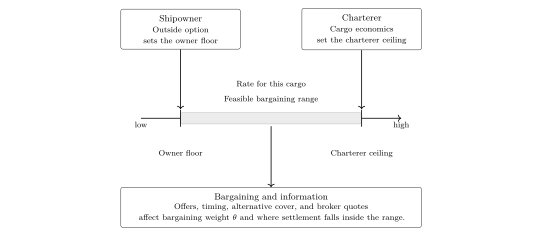
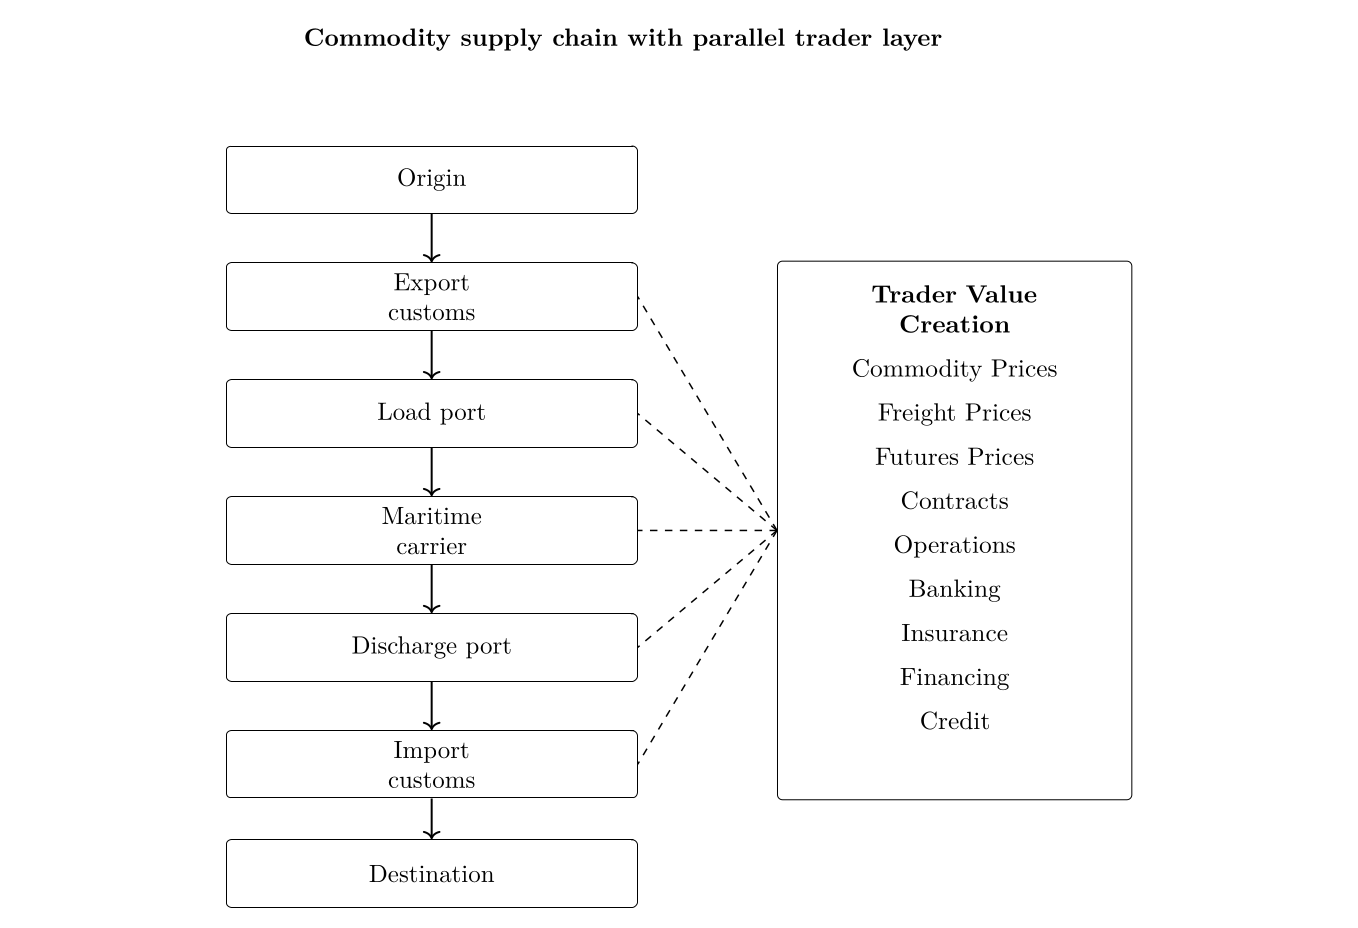
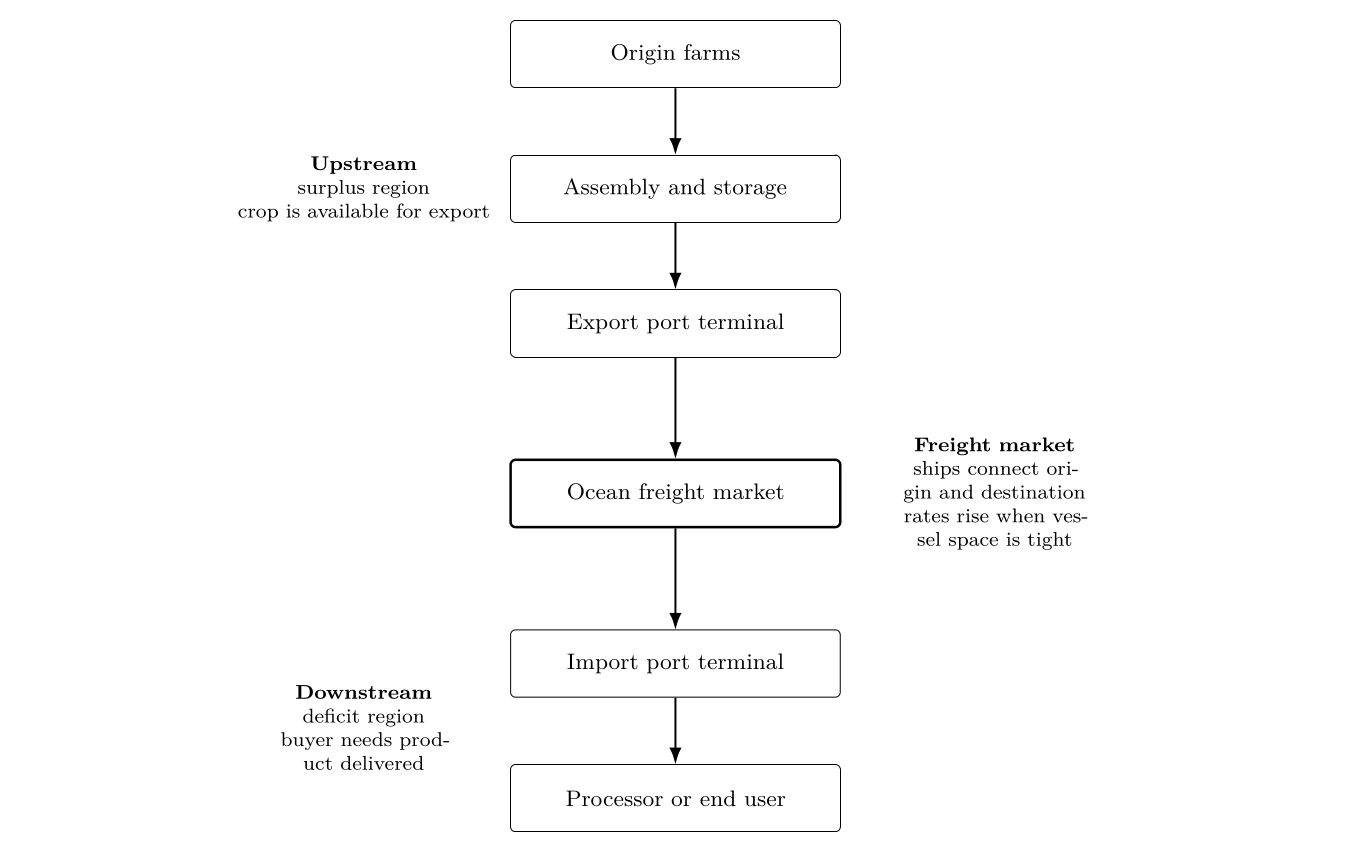
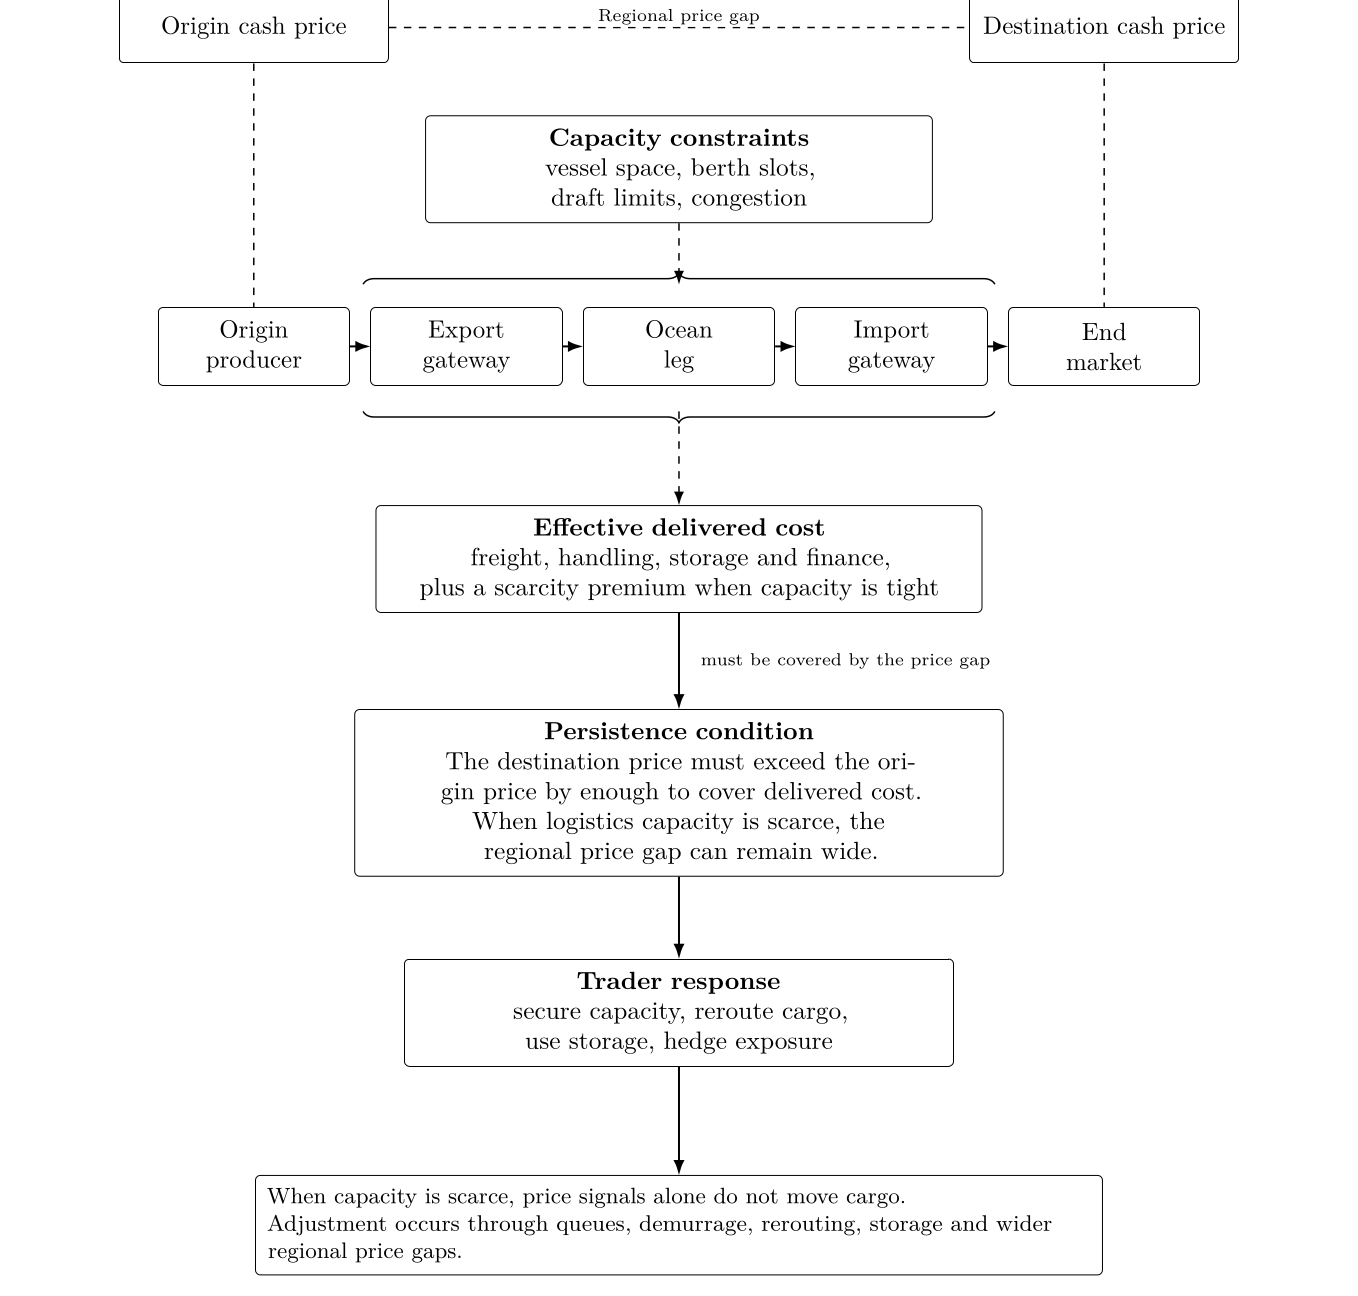
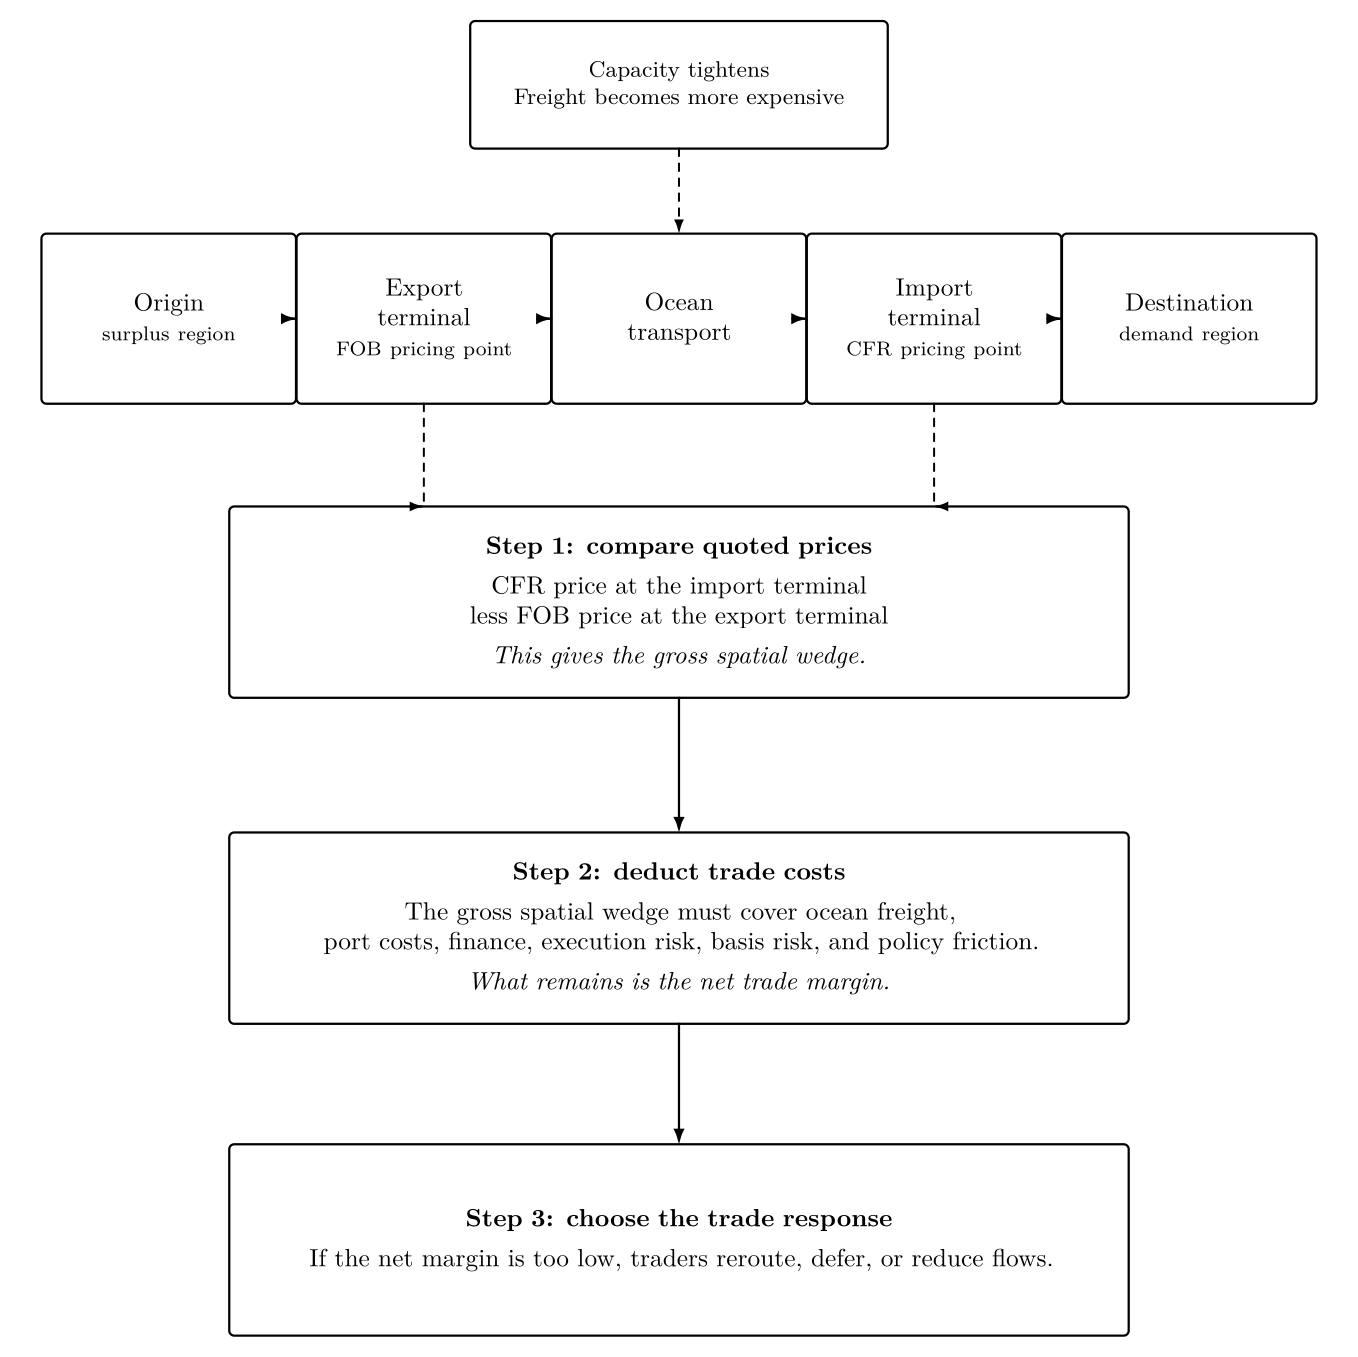
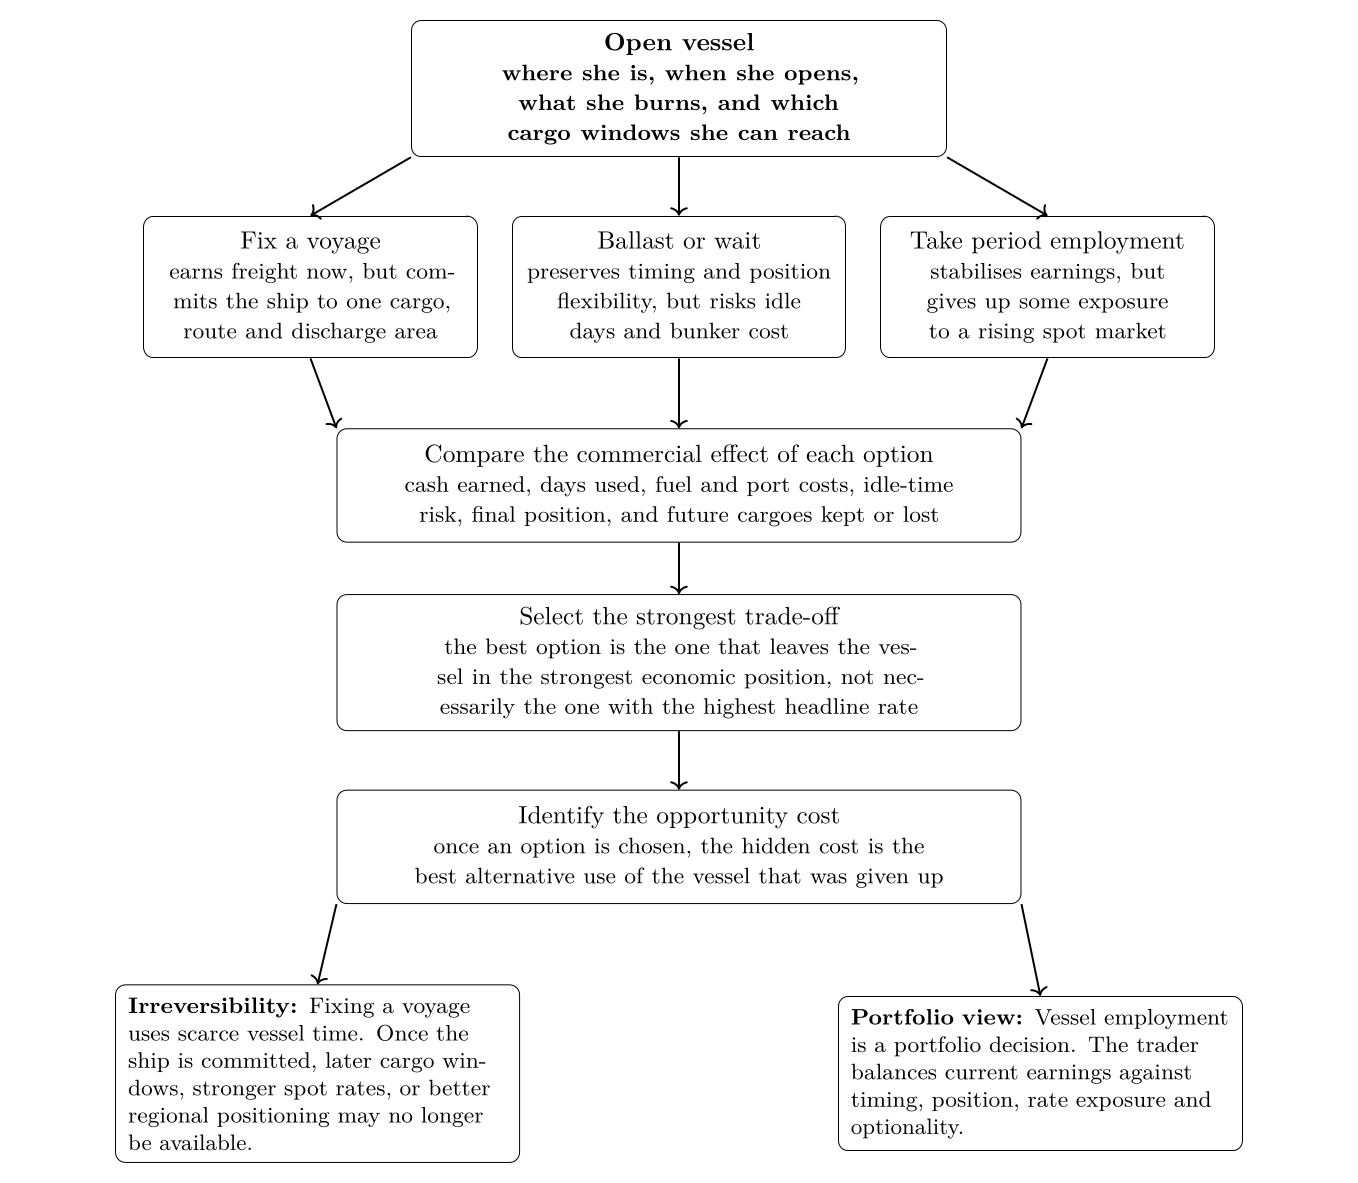
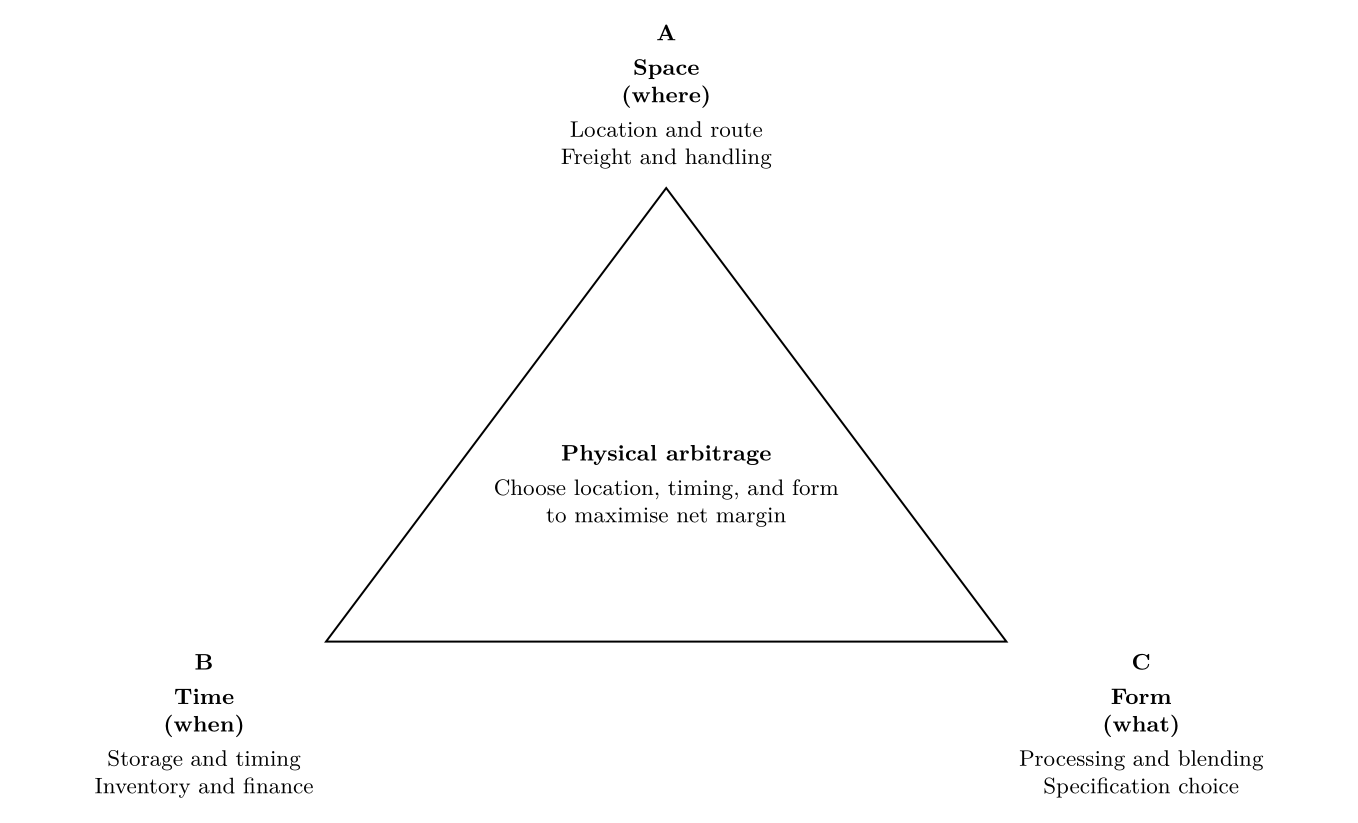
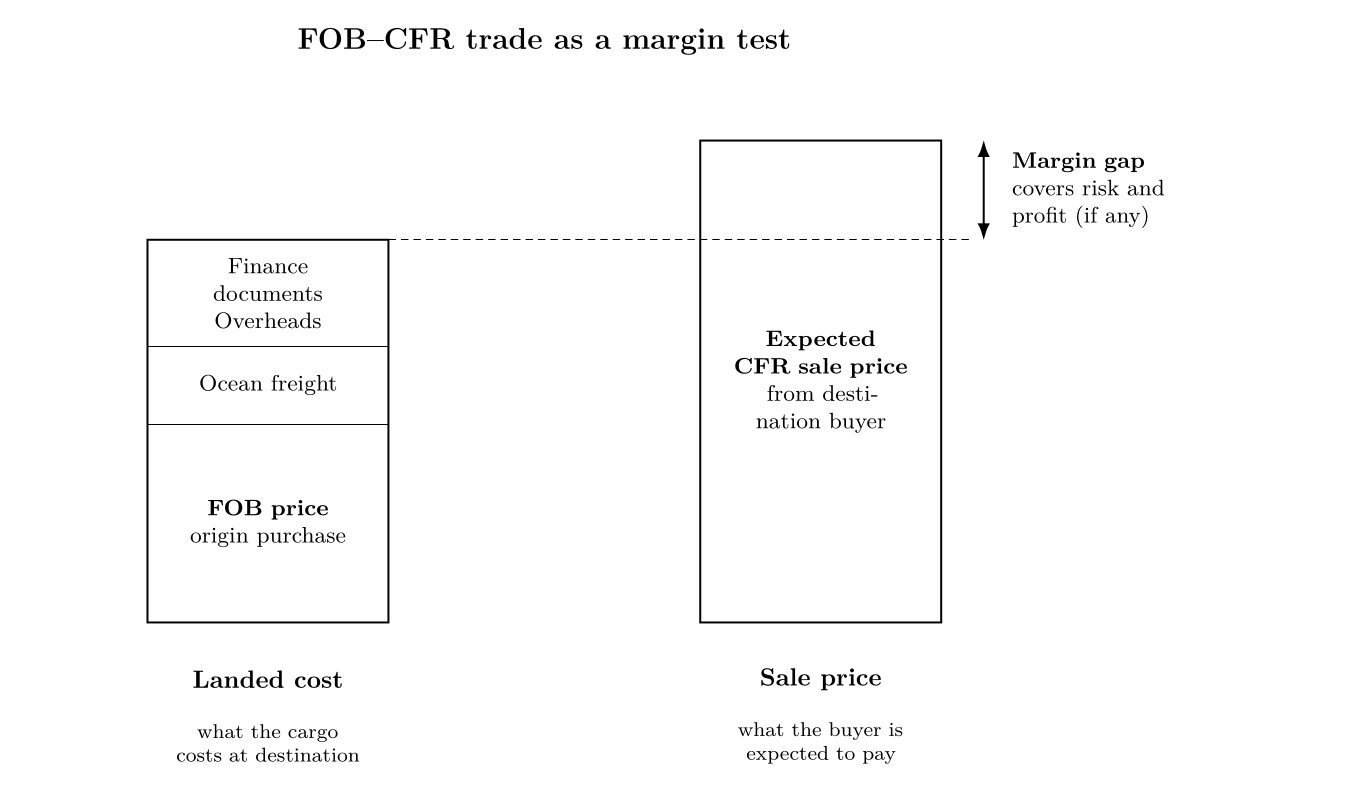
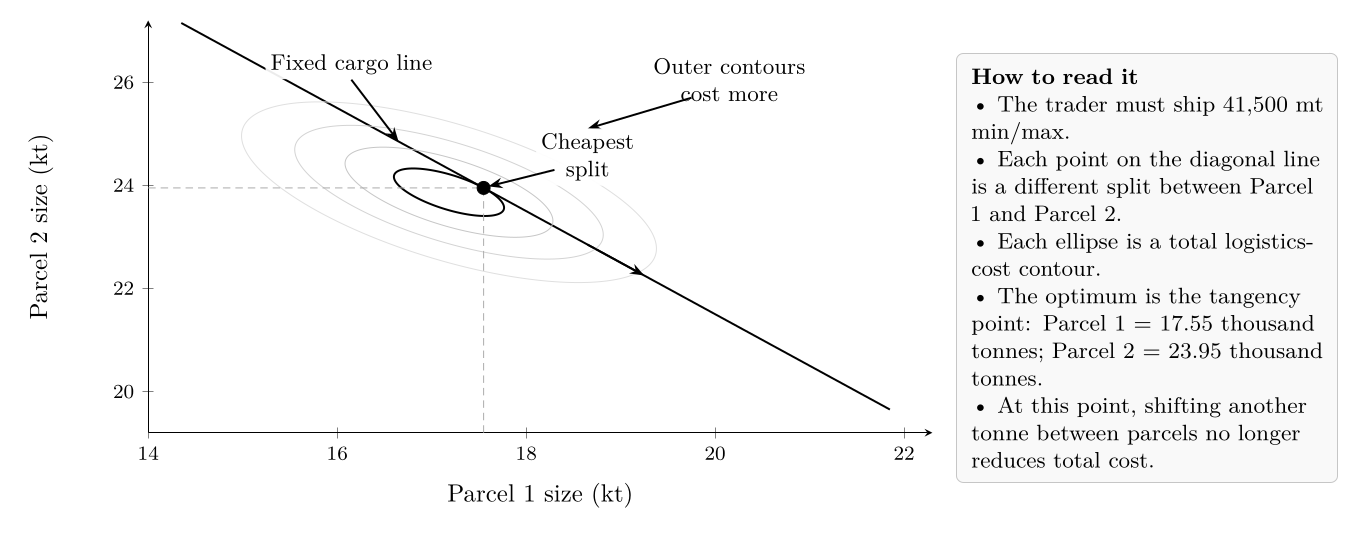
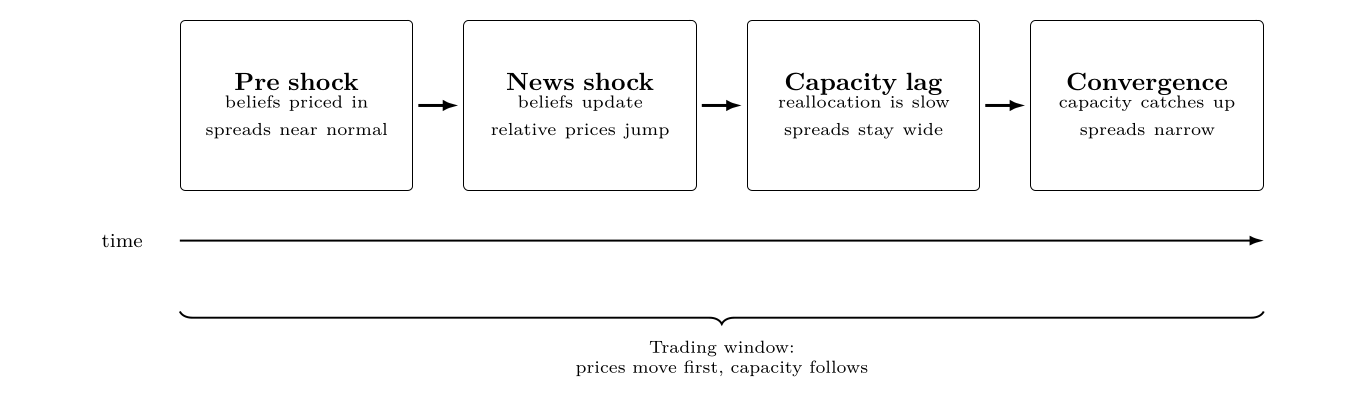
Vertical supply chain view showing the trader as a parallel value-adding layer across the execution chain. The trader creates value by reducing transaction costs, coordinating logistics and contracts, providing finance, and bearing risk between export and import.
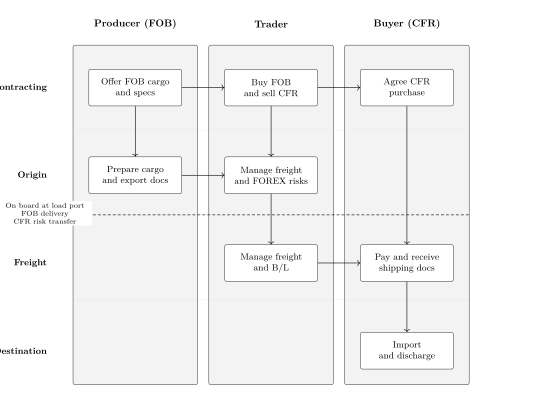
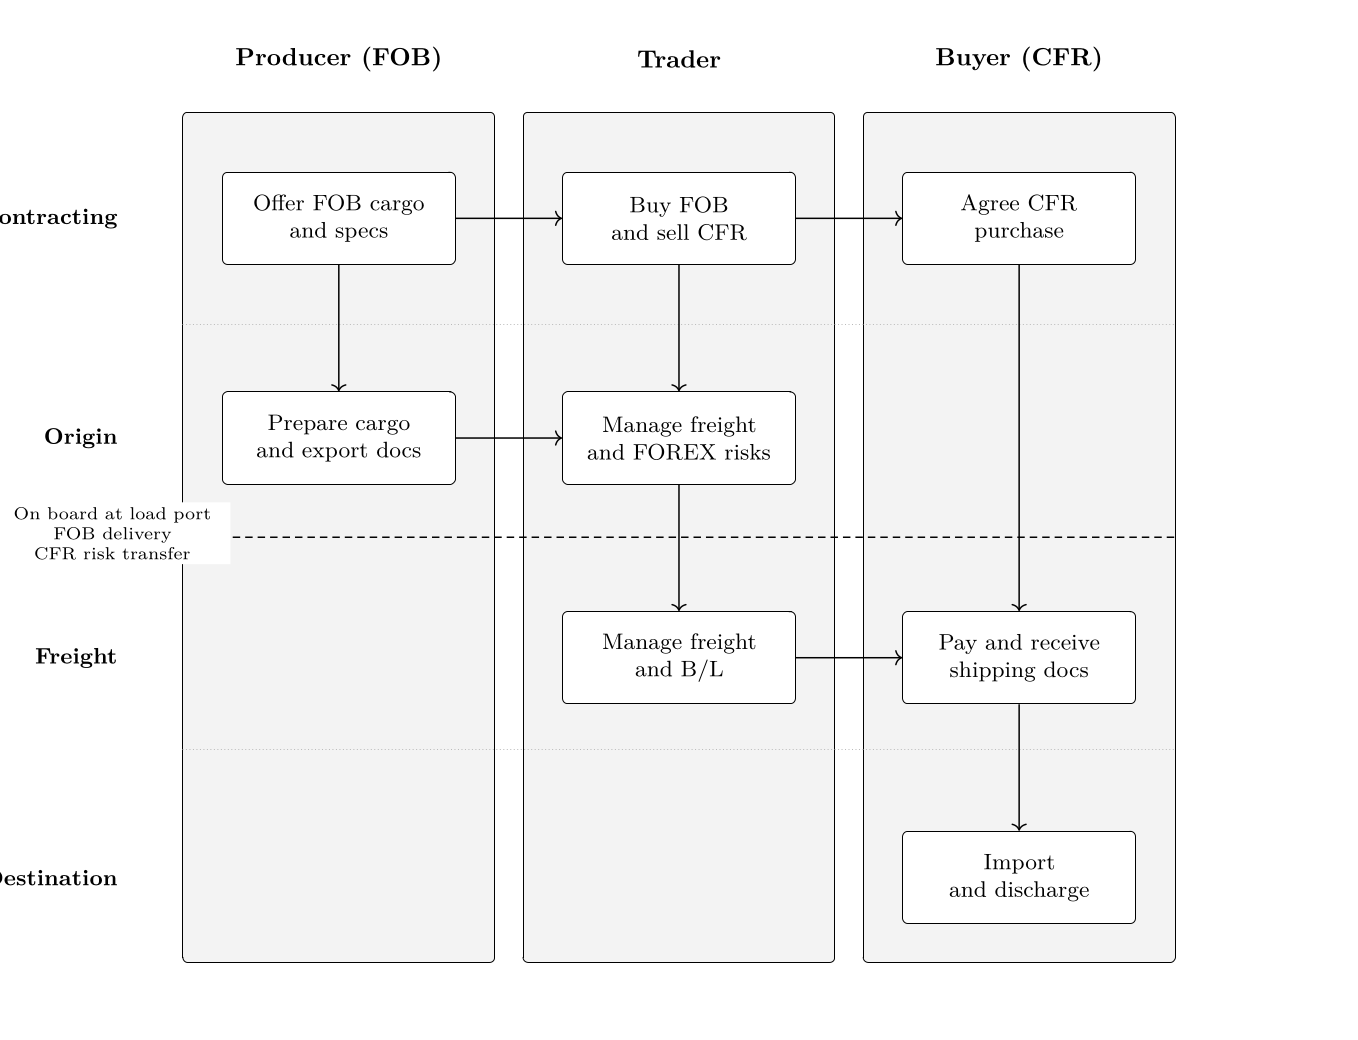
Responsibility across an FOB-CFR trading chain. Note that the figure is arranged to be read from top to bottom by phase. The dashed horizontal line marks the load port point where FOB delivery occurs and risk transfers to the buyer under CFR.
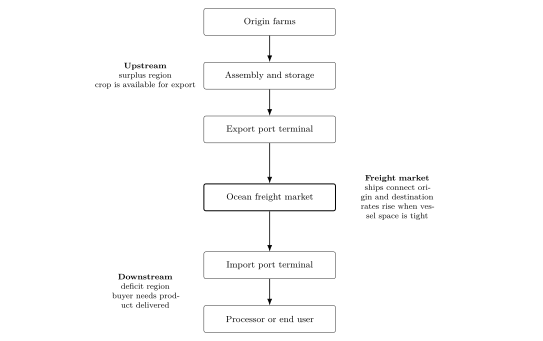
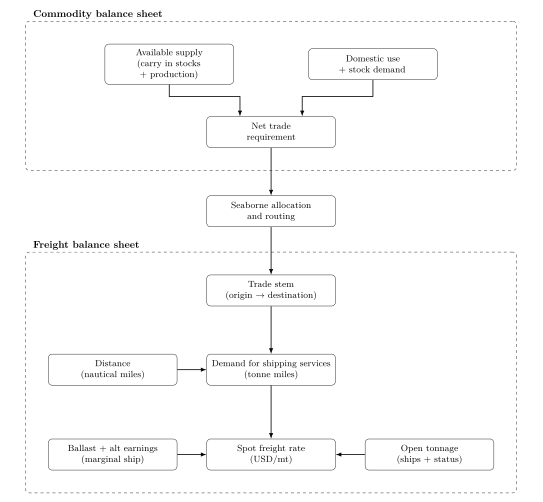
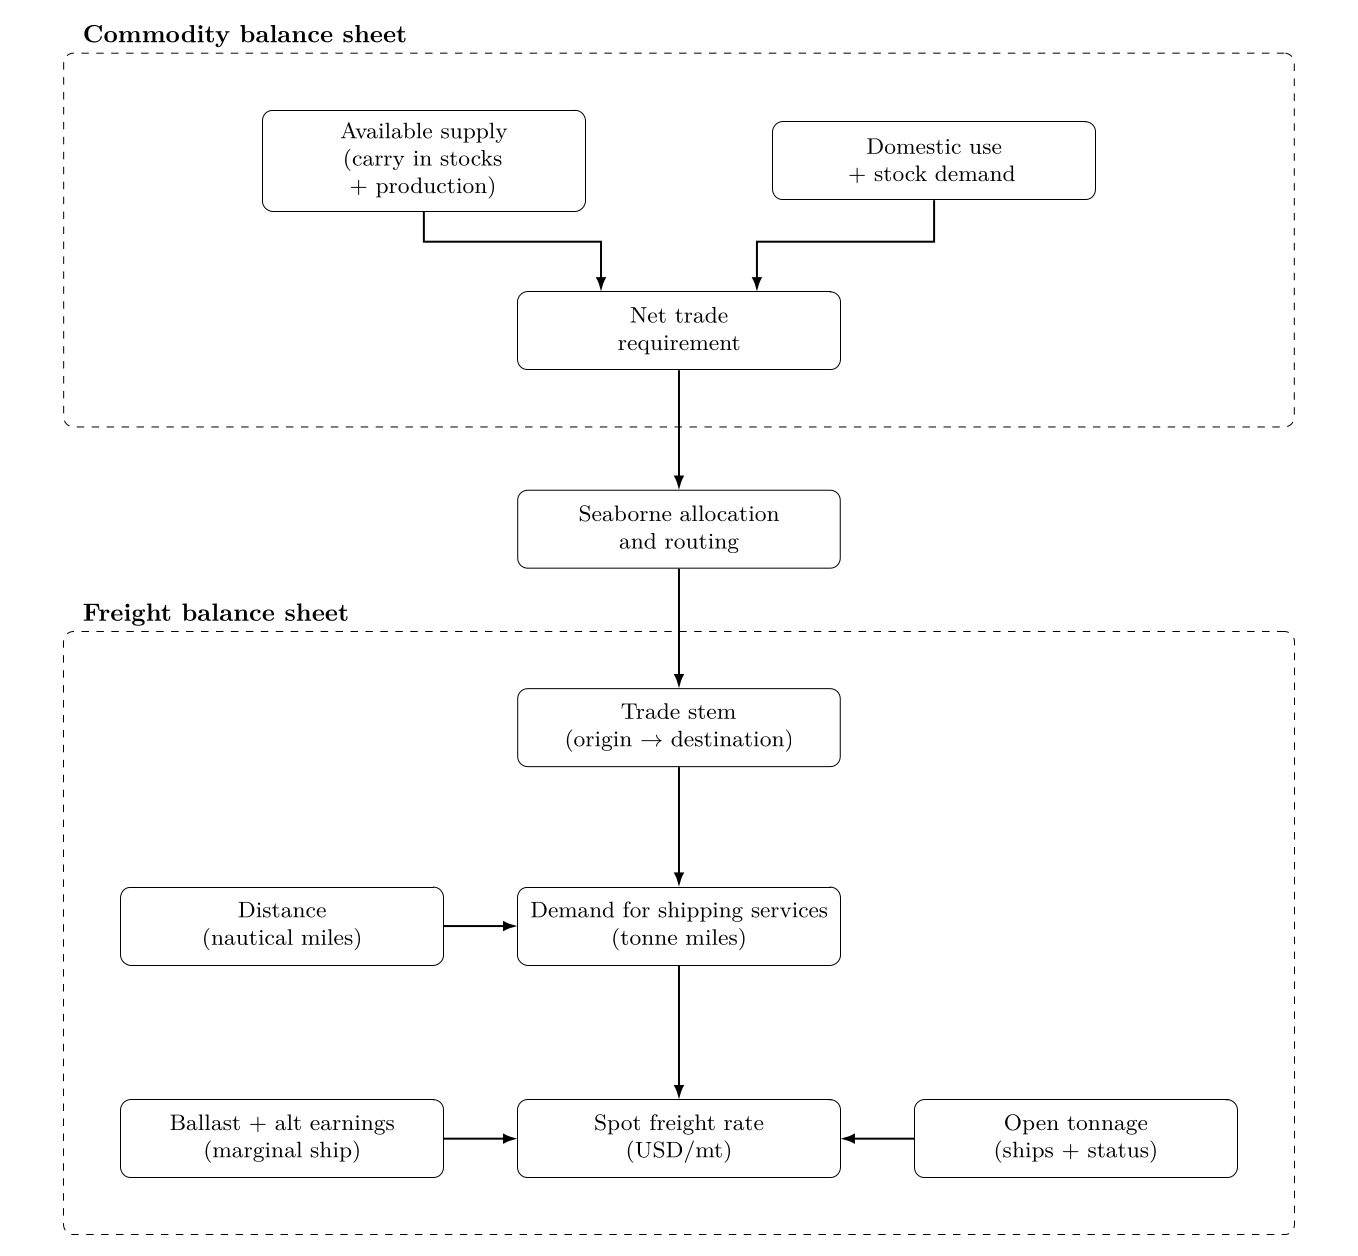
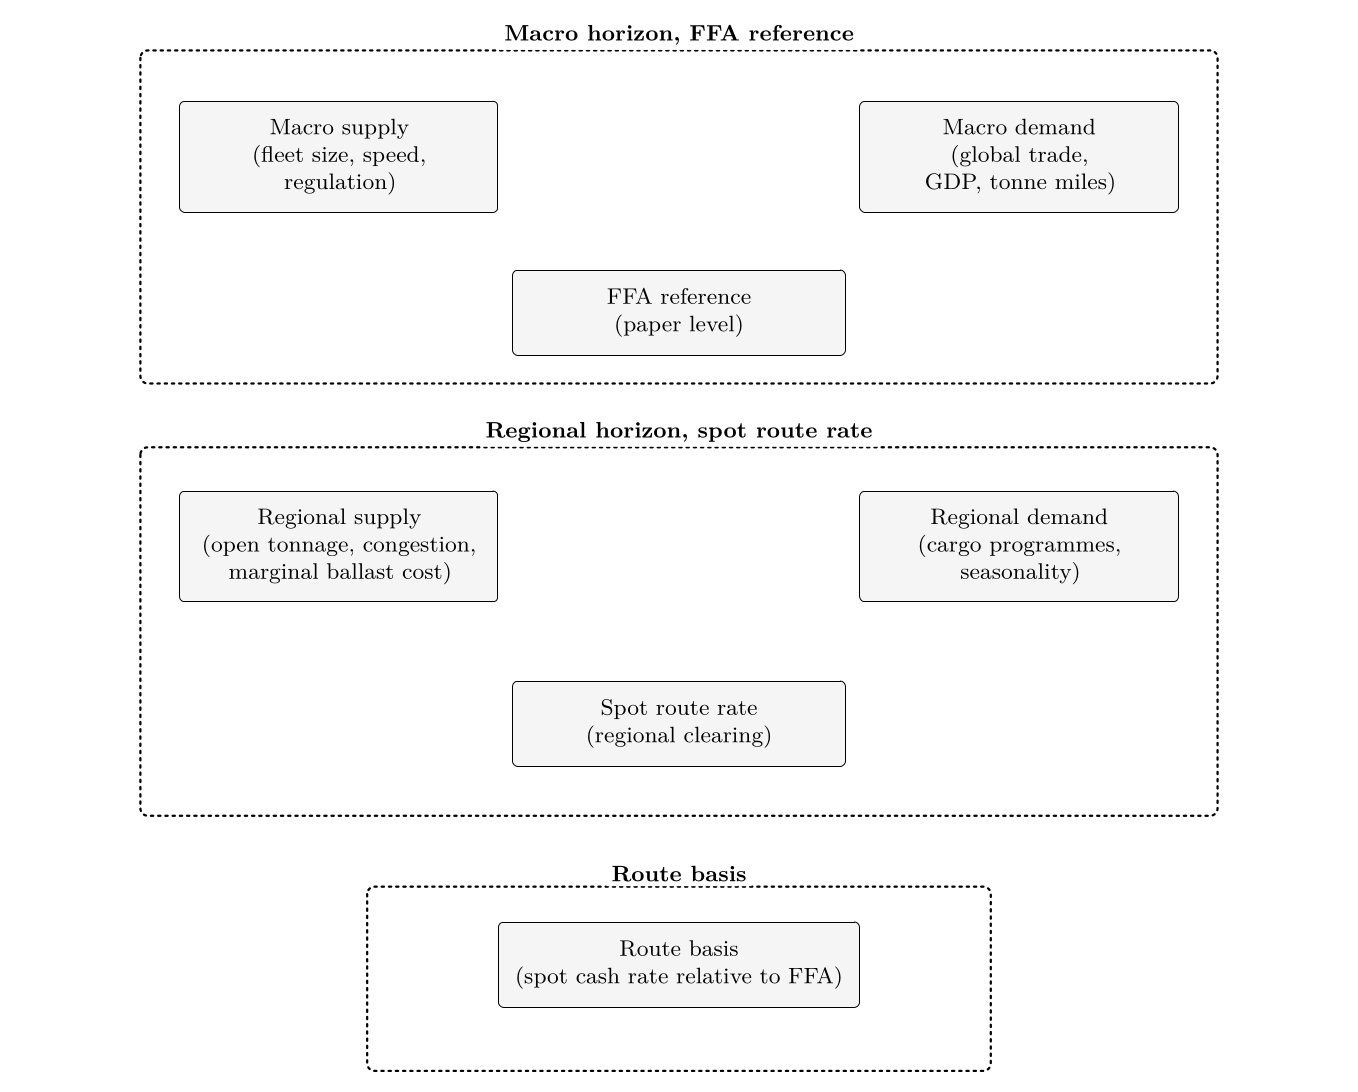
From commodity fundamentals to freight clearing. Commodity fundamentals determine net trade requirements, which are translated into seaborne allocation and routing, trade stems, and demand for shipping services measured in tonne miles. Freight rates then clear transport demand against open tonnage and the marginal ship's reservation level.
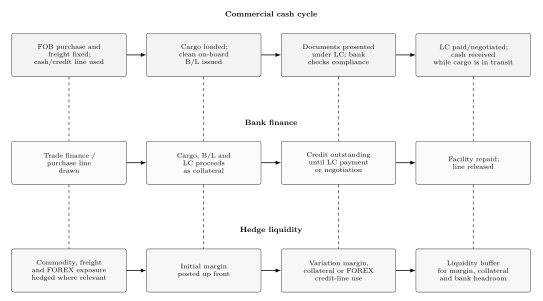
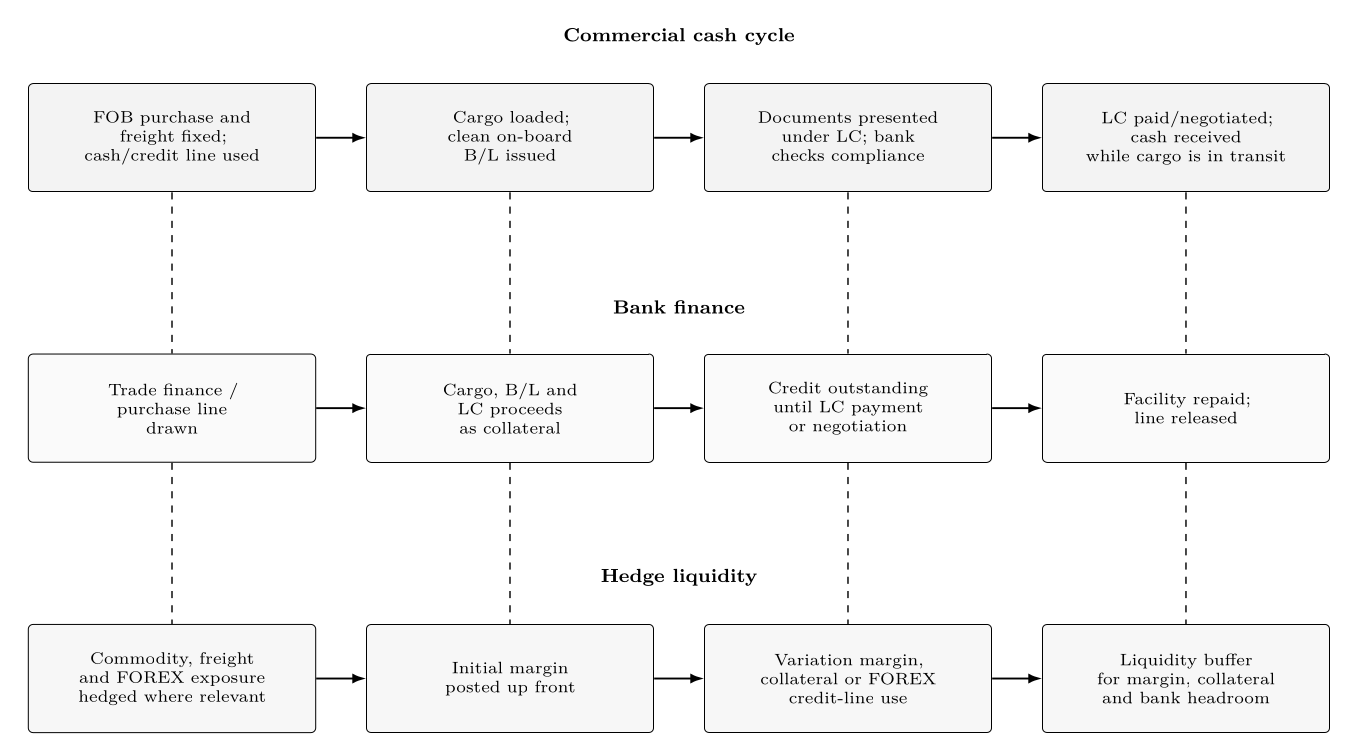
Working capital and liquidity in a CFR trade under a sight letter of credit.
Solid arrows show the sequence within each band. Dashed links show dependencies
across the commercial cash cycle, bank finance and hedge liquidity. Payment timing
differs under CAD, usance LC and open-account terms.
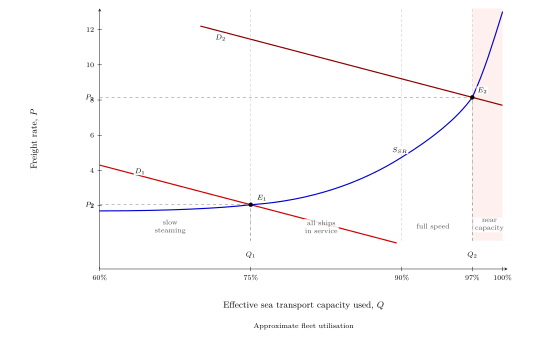
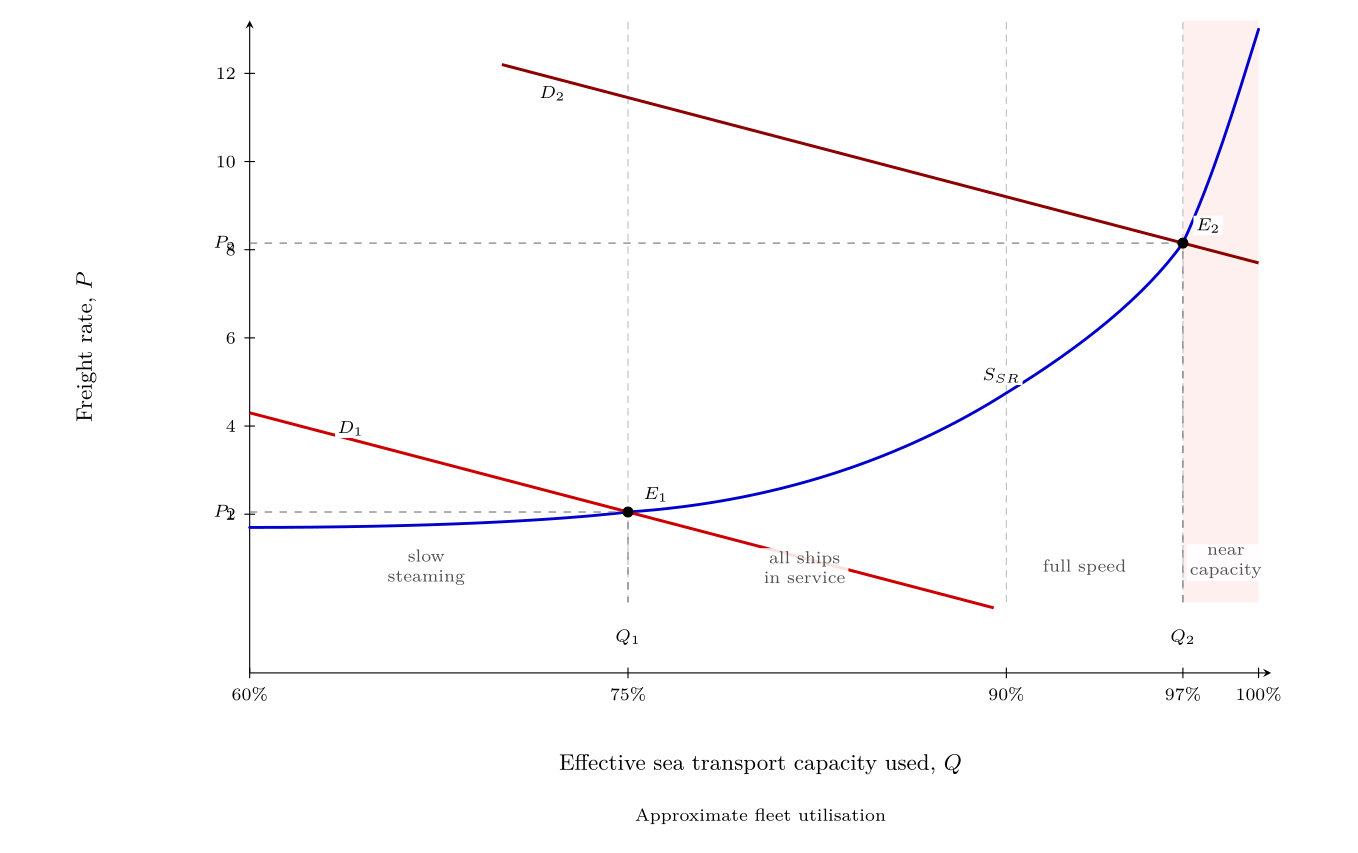
Short run fleet supply is relatively flat at low utilisation and steep near capacity. As demand rises from \(D_1\) to \(D_2\), equilibrium moves from \(E_1\) to \(E_2\). Quantity increases modestly, from \(Q_1\) to \(Q_2\), but freight rates rise sharply, from \(P_1\) to \(P_2\), because spare capacity is limited.
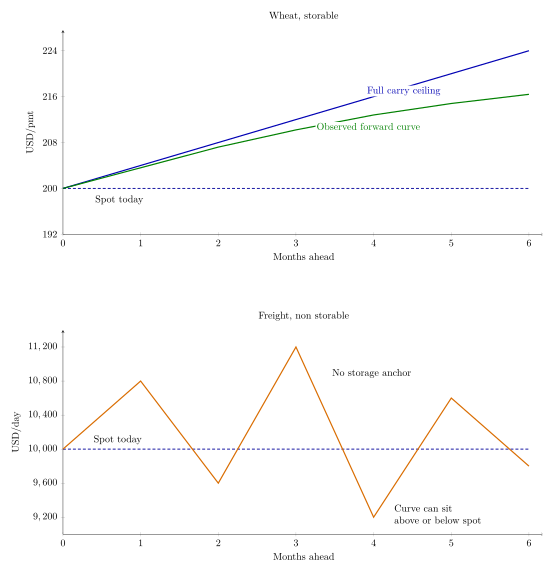
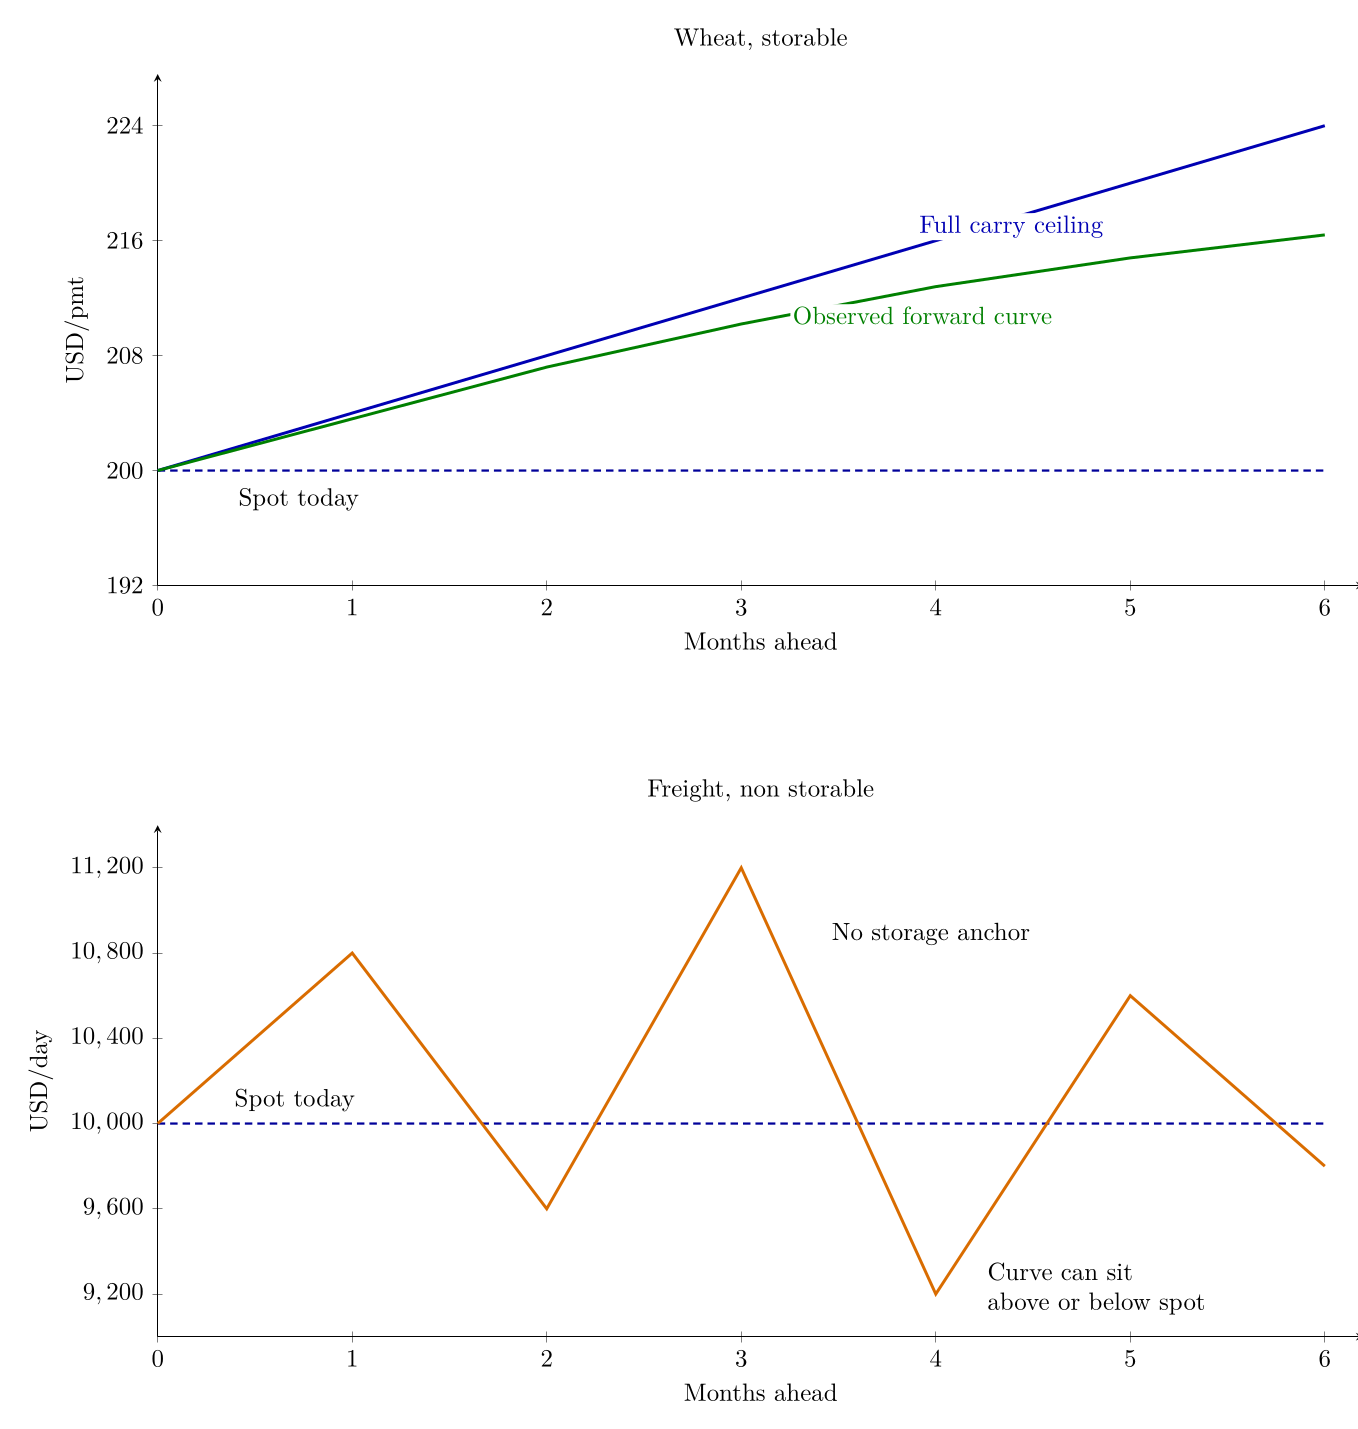
Storability links spot and forward prices for wheat through carry, while freight has no storage anchor. In the top panel, the dashed line is today’s spot price, the blue line is the full carry ceiling and the green line is the observed forward curve. The top panel is in USD/pmt and the bottom panel is in USD/day.
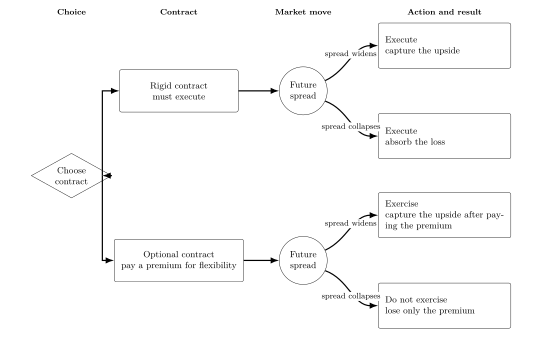
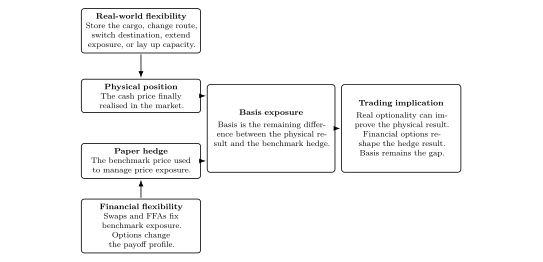
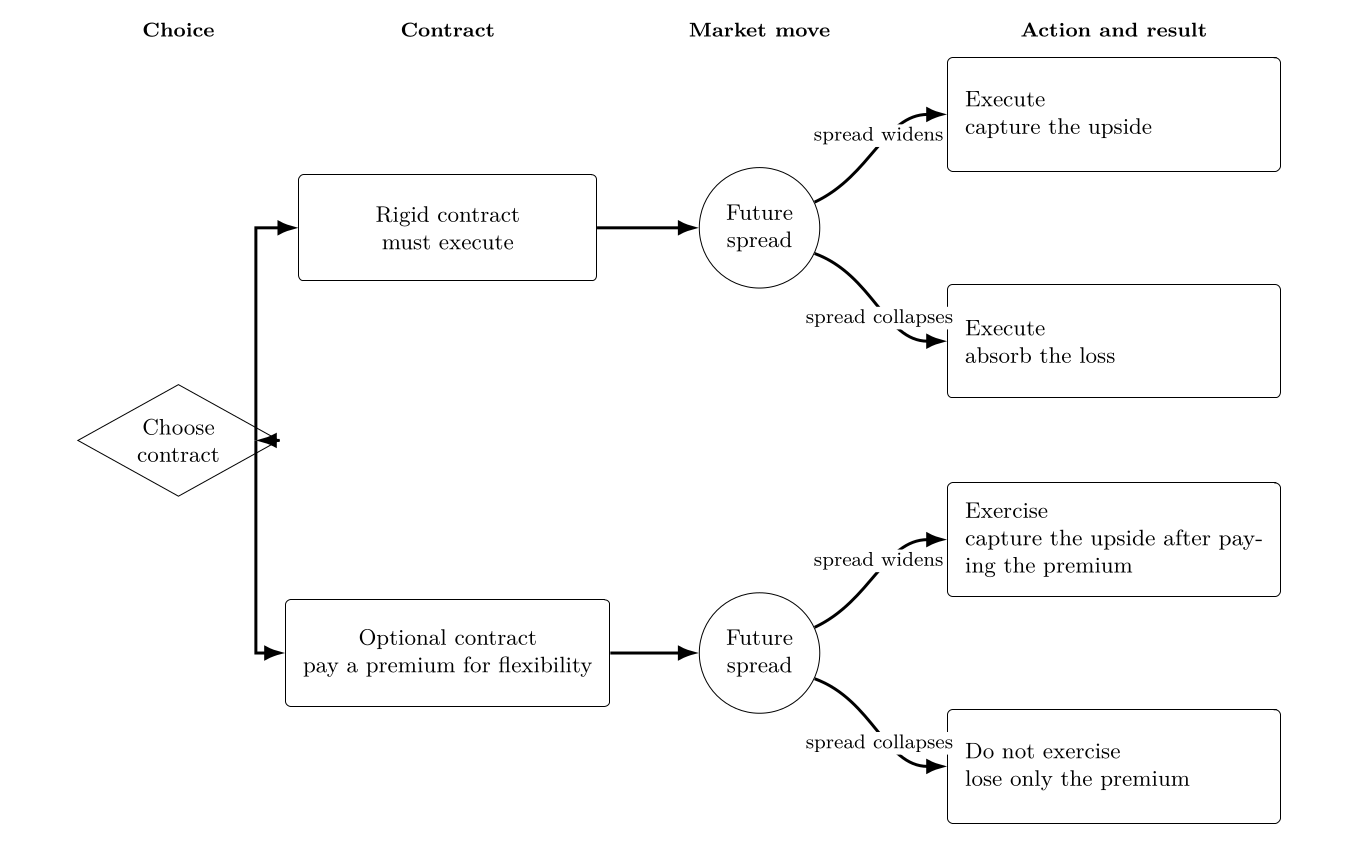
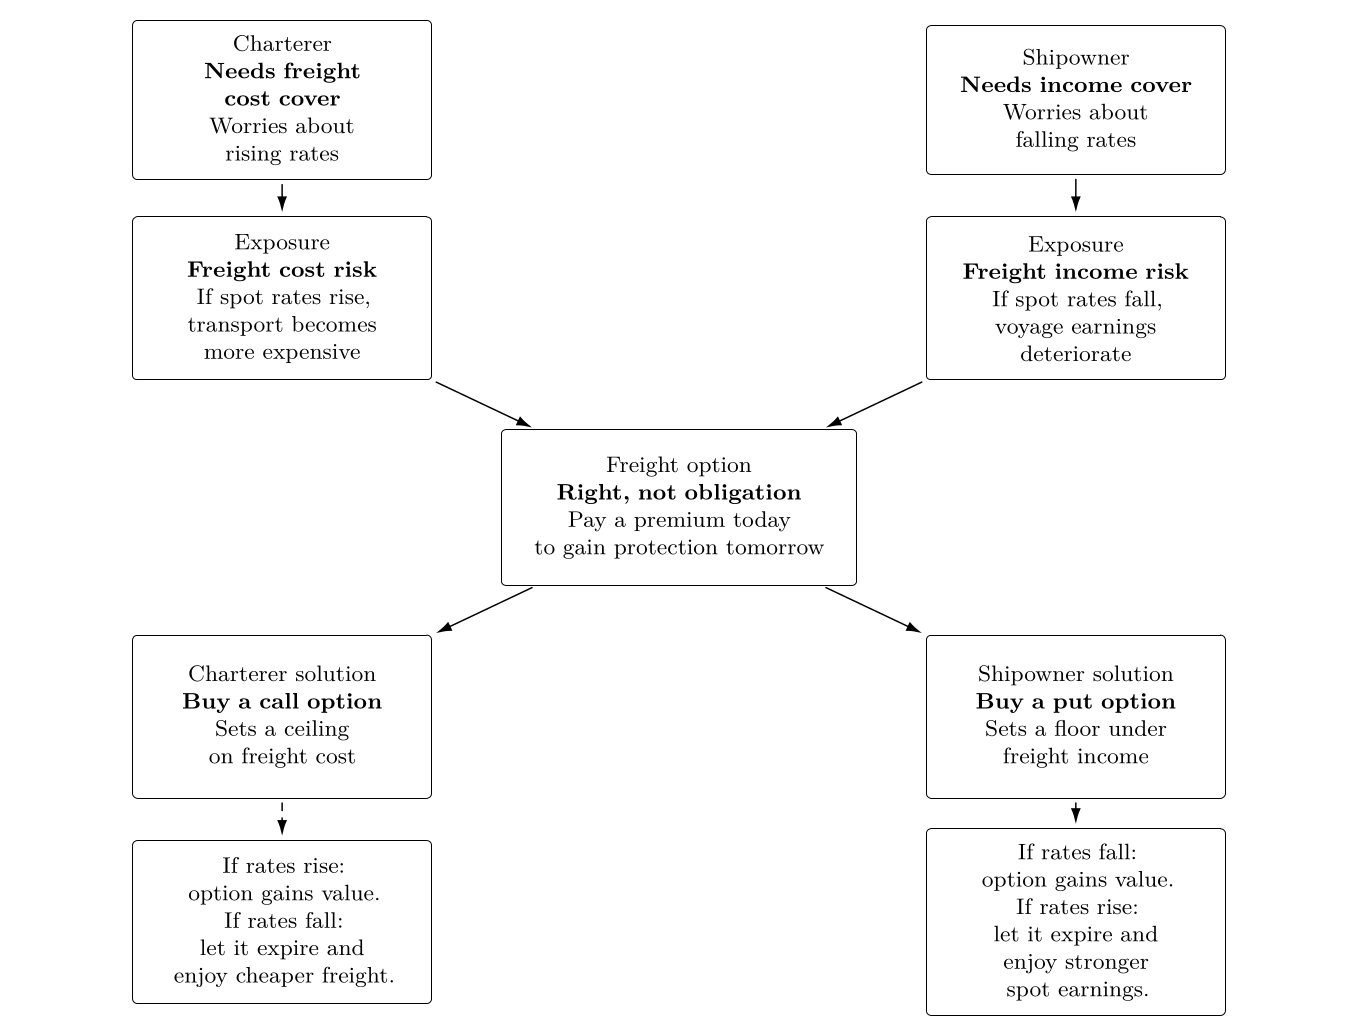
Optionality changes the commercial result while leaving spread uncertainty unchanged. Note that the action and result depend on whether the trader is long or short a call or put option.
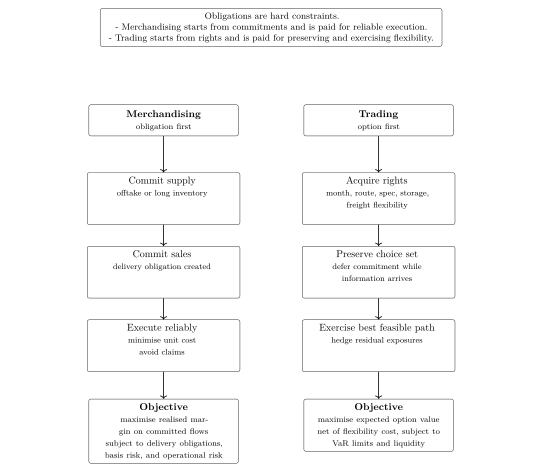
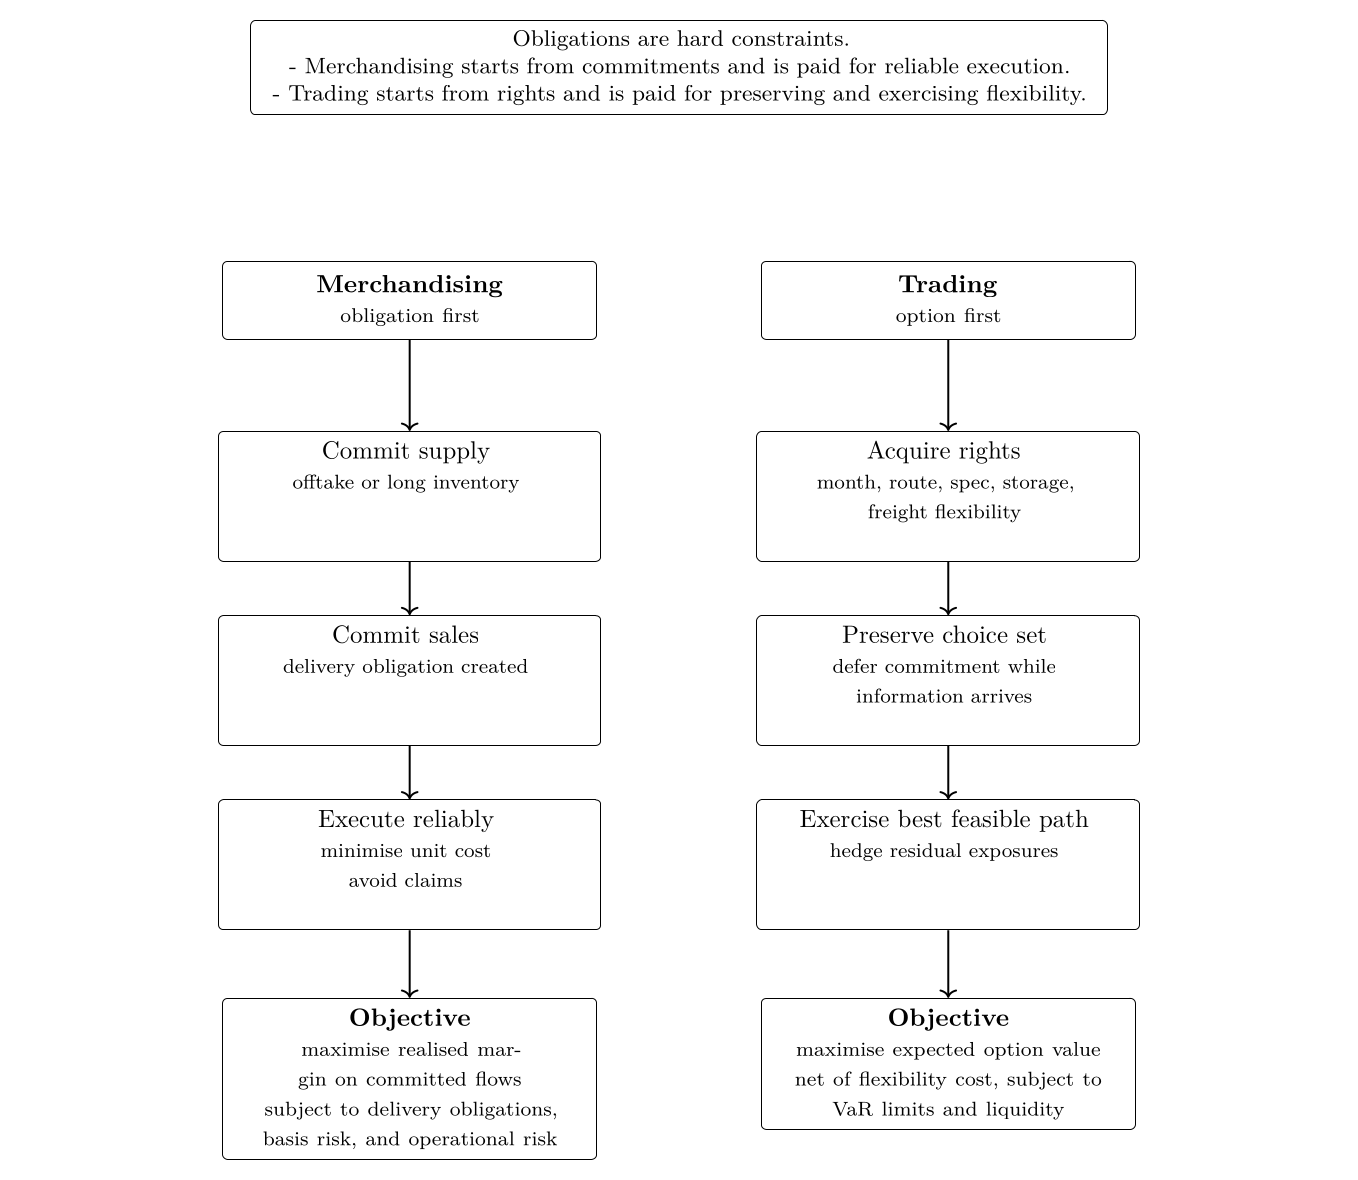
Merchandising creates value through reliable execution of committed flows. Trading creates value through preserving and exercising flexible rights under hard constraints.
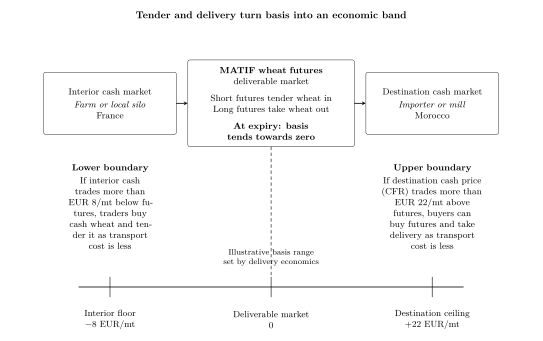
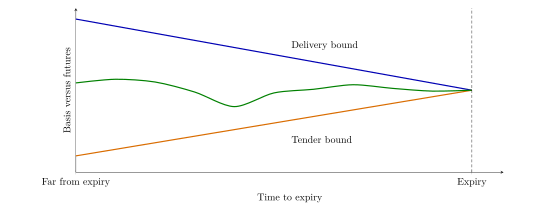
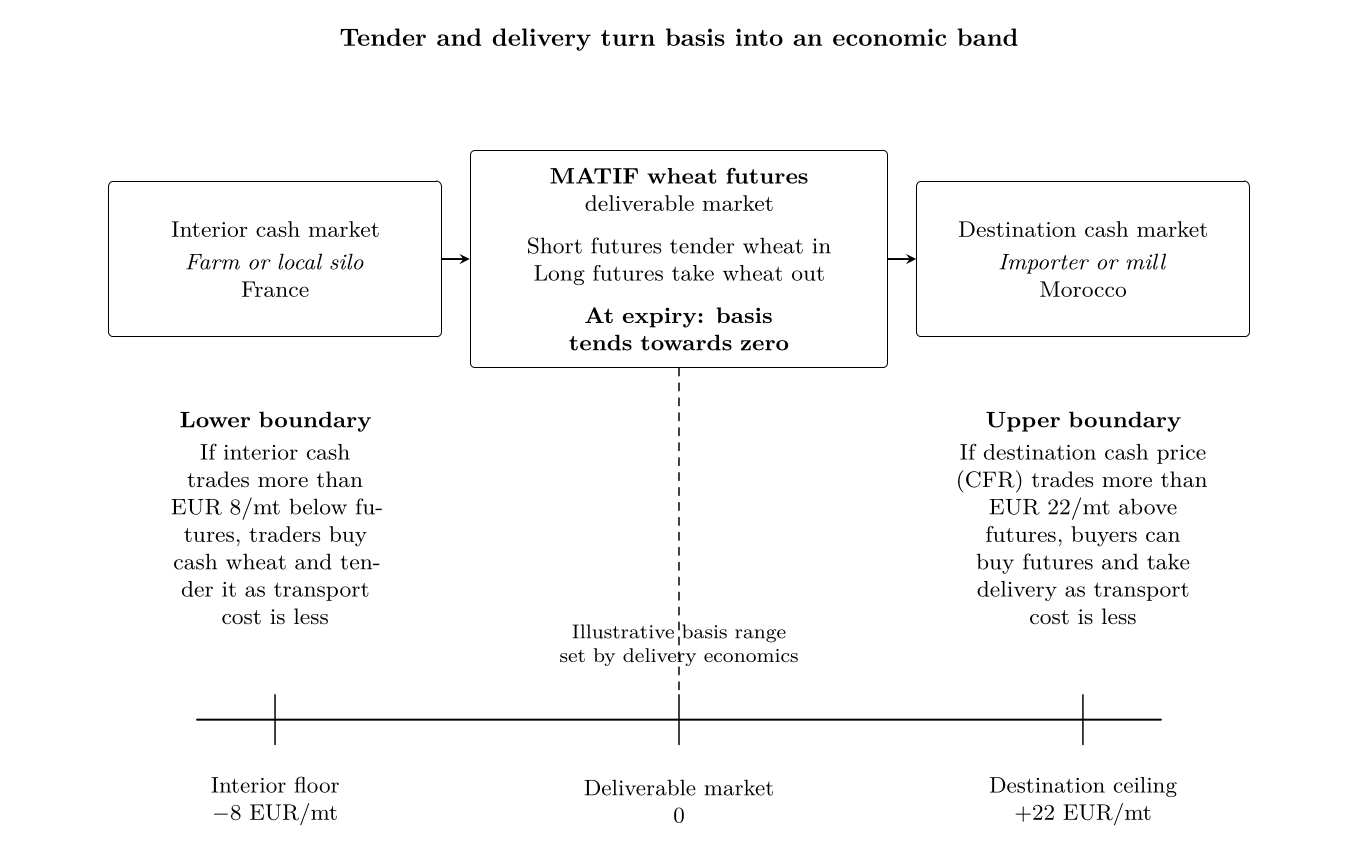
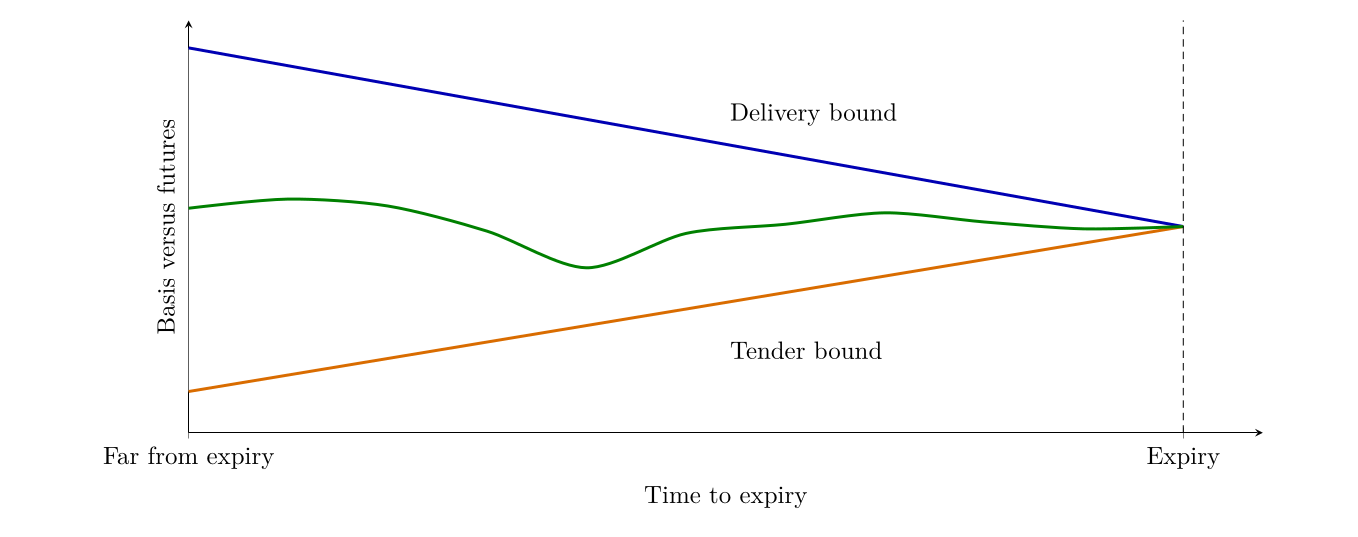
Tender and delivery impose economic boundaries on basis. At the futures delivery point, basis converges towards zero as expiry approaches. Away from the deliverable market, transport costs create a band around the futures benchmark: interior cash cannot remain far below futures once tendering becomes economical, and destination cash cannot remain far above futures once taking delivery becomes economical. Note certain assumptions on transport costs are necessary for decision makers
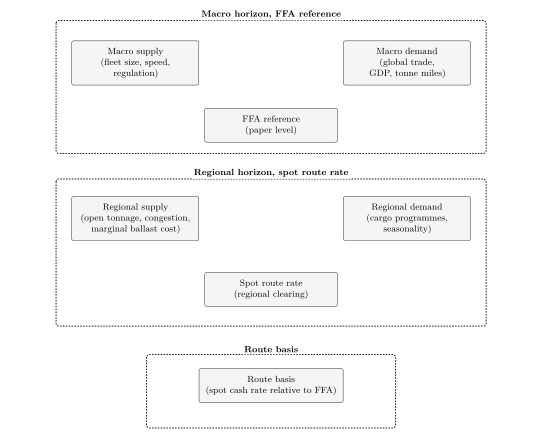
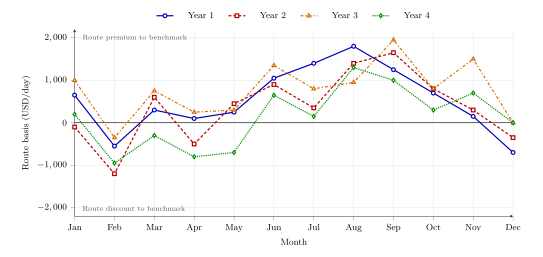
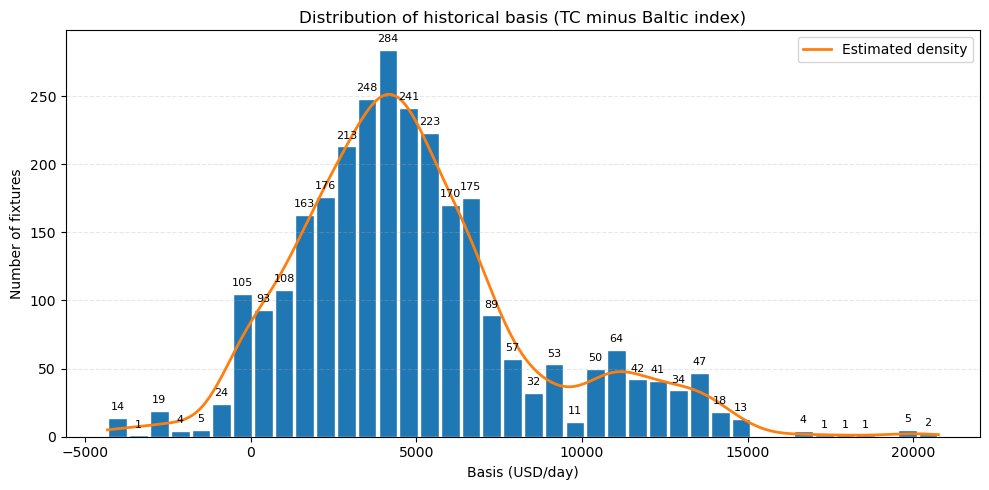
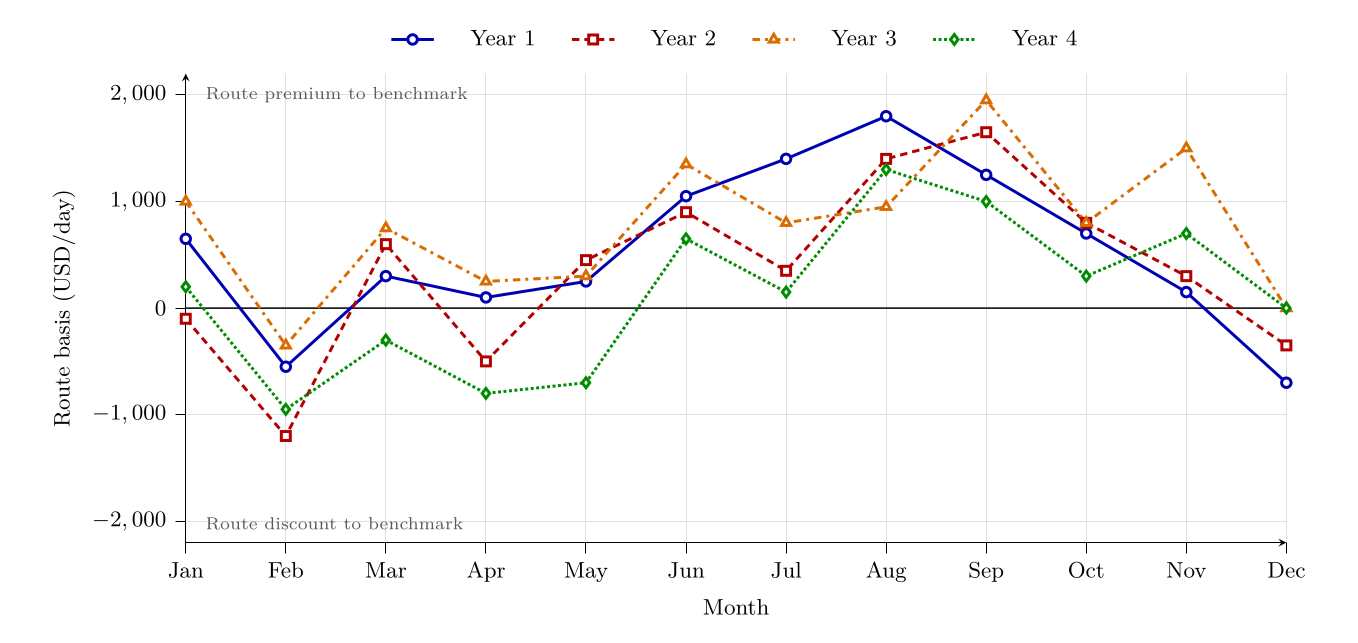
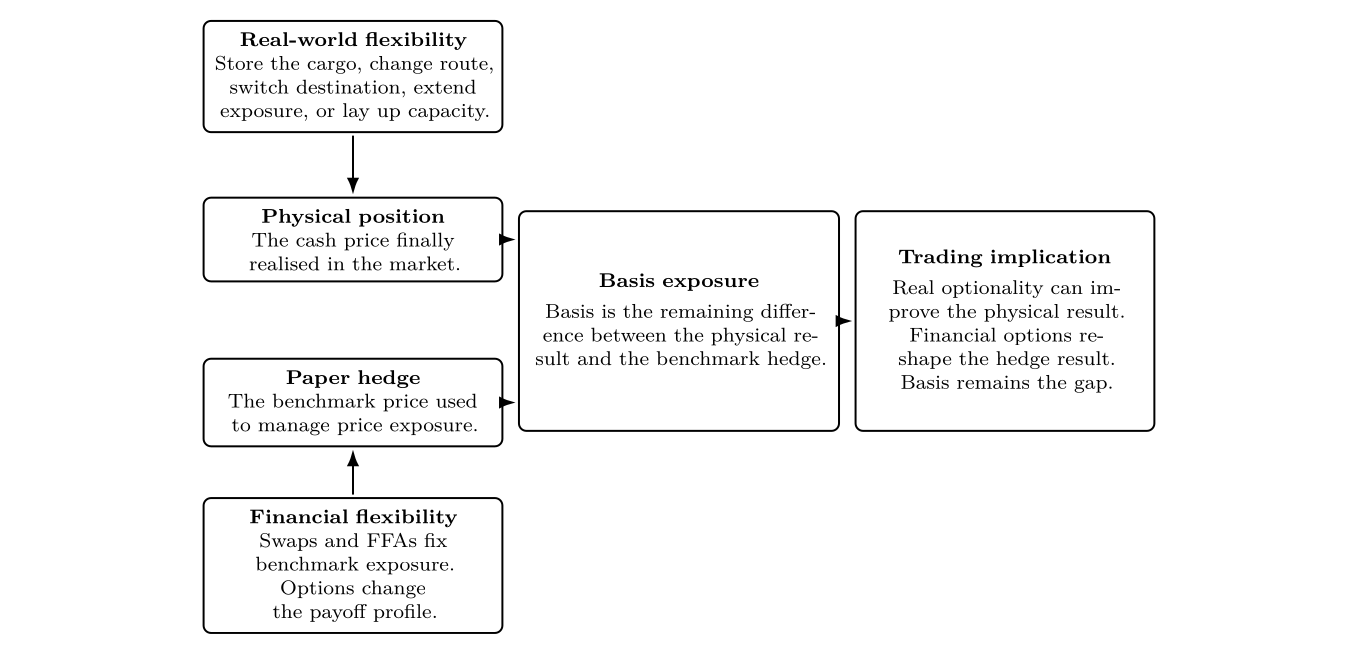
Illustrative monthly route basis for a Time Charter trip from region A to region B on a Handysize vessel across four years. Basis is the physical route time charter equivalent less the relevant Baltic Handysize benchmark, measured in USD/day. Positive values indicate a route premium to the benchmark, while negative values indicate a discount. The common monthly shape represents recurring seasonality, while the differences across years represent market conditions specific to each year.
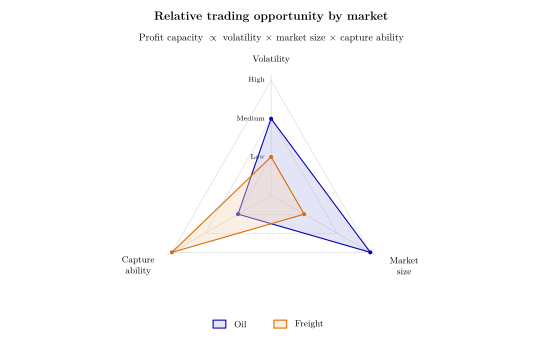
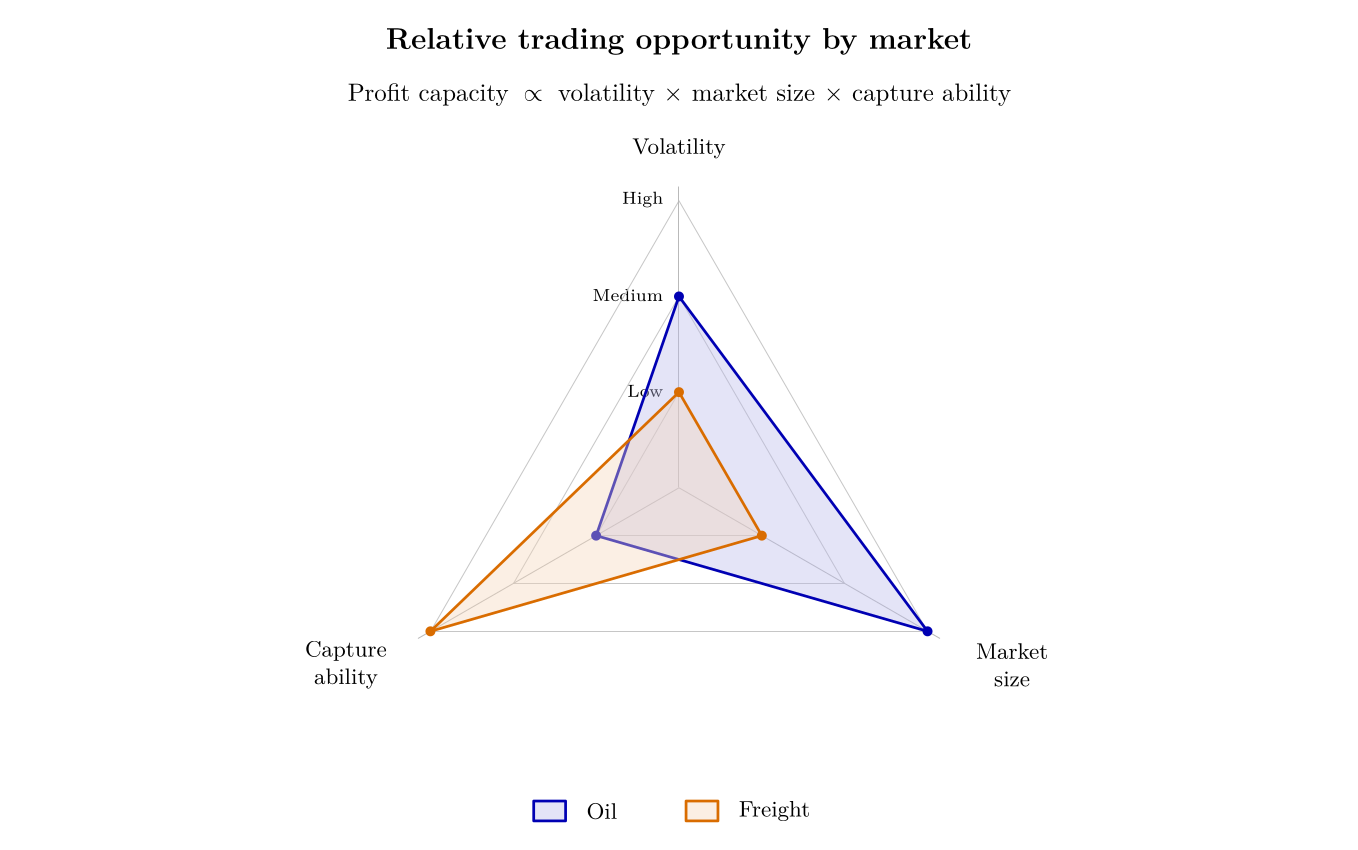
Illustrative example of how to think about different markets presented by market on an ordinal radar scale. Each axis is scored as low, medium, or high. Oil scores medium on volatility, high on market size, and low on capture ability. Freight scores low on volatility and market size, but high on capture ability. The shaded areas summarise relative position across axes; they are not estimated profit surfaces. Note that some freight markets can be more volatile than oil, and vice versa.
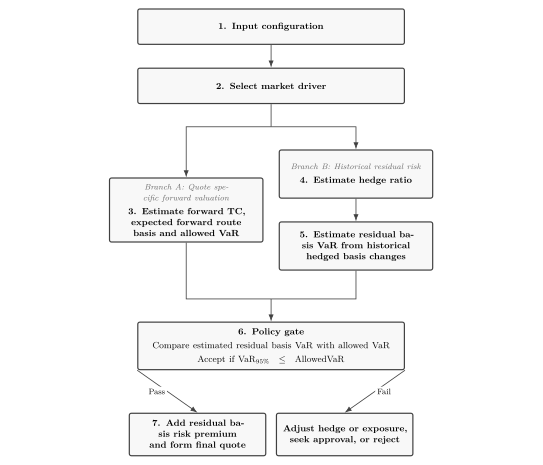
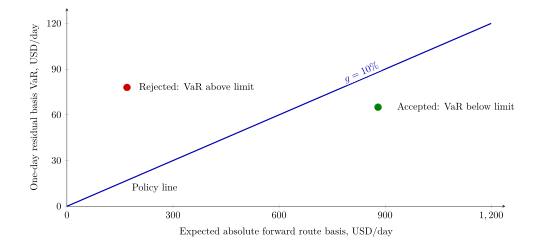
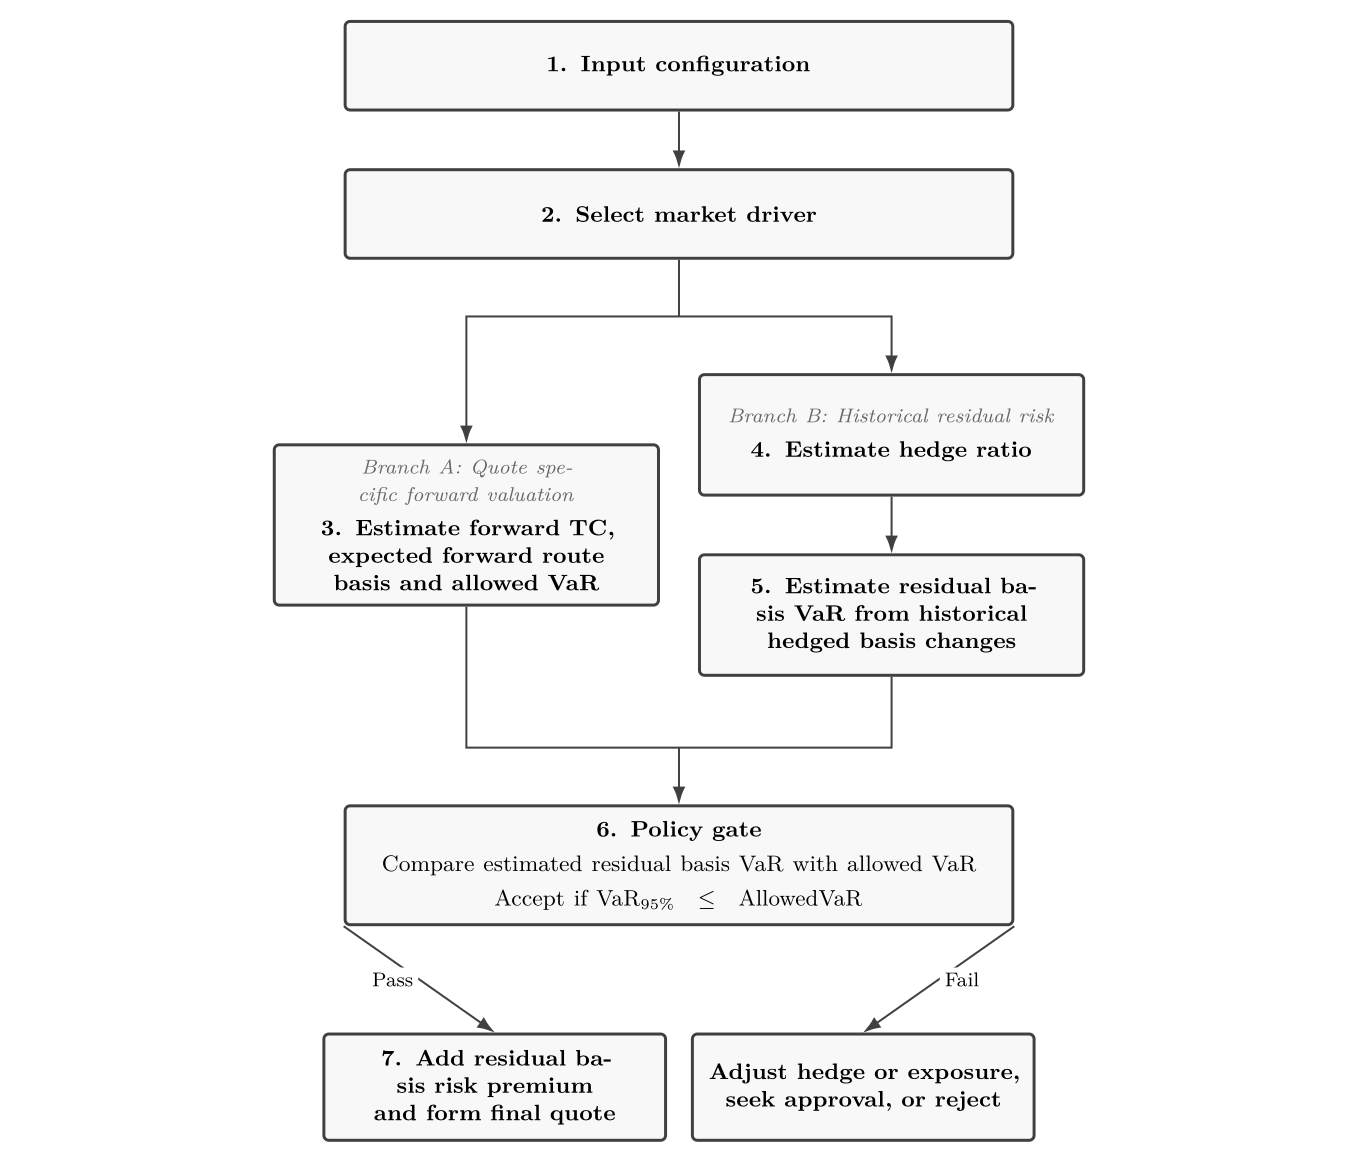
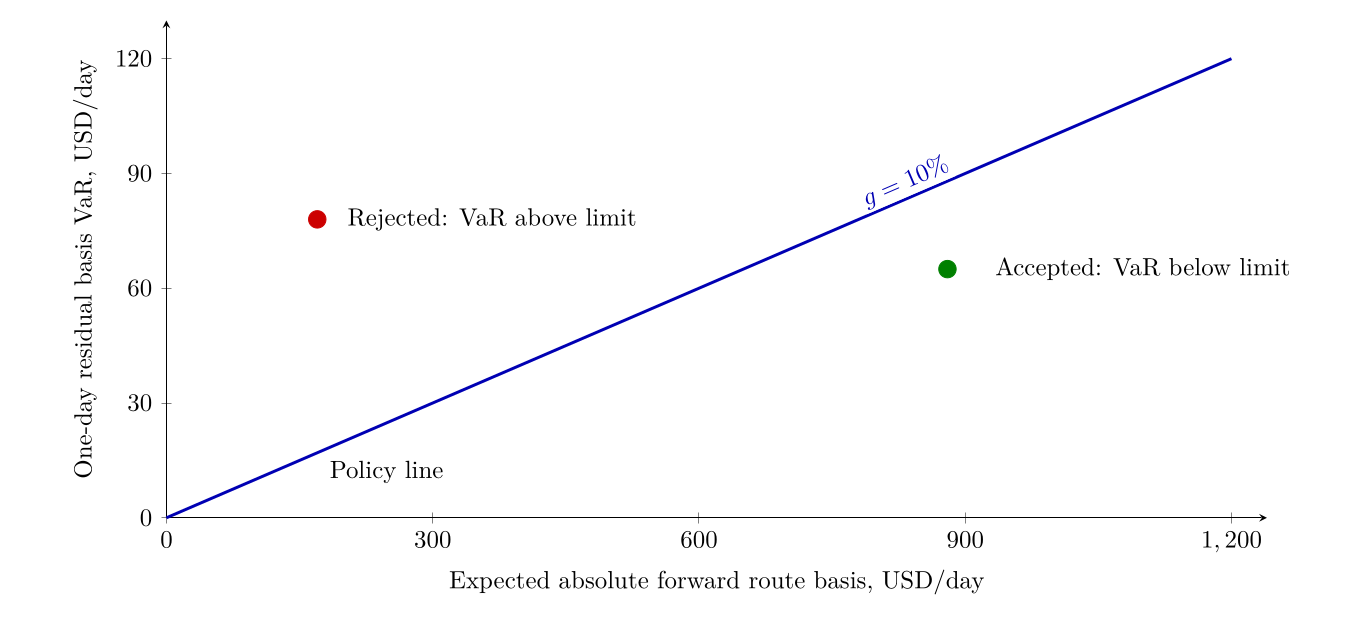
Parallel workflow for VaR based freight pricing. Branch A estimates the quote specific forward value and allowed VaR. Branch B independently estimates residual basis VaR from historical hedged basis changes. The two outputs meet at the policy gate.