Basis Trading
Jump to a section3 sections in this chapter
Fundamentals of Basis Trading
Basis = Cash Price – Futures Price
The previous chapter showed how balance sheets help traders identify local balance divergence from the market reference. This chapter explains how such divergence - known in trading terms as basis - can be managed and traded. Basis is the difference between the cash (spot) price of a commodity and its corresponding futures price Luc Nijs (2014). Mathematically, it can be expressed as:
The equation is simple yet powerful. By engaging in basis tradingBasis tradingTrading and hedging built around changes in basis, the difference between a cash price and the price of the hedging instrument.Open in terminology, traders change the question from "will the commodity price go up or down?" to "will my local physical price strengthen or weaken relative to the benchmark?" This shifts the focus from the cash price to the relative value.
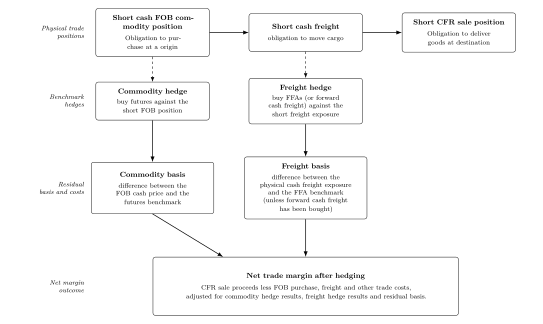
Formation of the net trade margin after hedging for a theoretical CFR sale done
Consider a trader who buys physical wheat in Poland at USD 300/metric tonne (mt) and simultaneously sells MATIF (Marché à Terme International de France) futures at USD 300/mt. The starting basis is zero. Later, the cash price increases to USD 320 per mt while the futures price rises to USD 318/mt. The basis has strengthened from zero to USD 2/mt. A trader who is long on the basis (meaning long physical wheat and short futures) profits from this strengthening because the cash position has improved more than the futures hedge has lost. The key here is not that the wheat cash price increased, but that the cash price improved relative to the futures reference.
The preceding wheat example describes a long basis position, where the trader owns physical wheat and sells futures. Formation of the net trade margin after hedging for a theoretical CFR sale done considers the opposite commercial sequence. Here, the trader has fixed a CFR sale before securing the FOB purchase and freight. The trader is therefore exposed to increases in both the FOB cash price and the freight cost. To reduce benchmark price risk, the trader buys commodity futures and FFAs. These hedges reduce benchmark exposure but leave commodity basis, freight basis and other trade costs. The final margin equals the CFR sale proceeds less the realised FOB purchase, physical freight and other trade costs, plus gains or losses on the commodity and freight hedges.
Basis trading is advantageous for several reasons. By hedging the general price level with futures, the trader is left mainly exposed to changes in the basis. This can make the position easier to analyse than a simple view on whether the commodity price will rise or fall. Instead of taking broad price risk, the trader focuses on the relationship between the cash price and the futures price. Futures markets also tend to be more liquid than physical markets, which makes it easier to enter, adjust or exit the hedge. Another advantage is that futures markets often react faster to new information, such as economic forecasts or weather disruptions, while physical cash markets usually adjust more slowly. This difference in the adjustment speed can temporarily widen or narrow the basis. For this reason, basis trading is not only a hedging tool; It can also create trading opportunities. However, basis trading does not eliminate risk. To understand this exposure, we need to examine what affects basis.
What affects basis?
Basis exists because a futures contract and a physical cargo are not the same thing. A futures contract is a standardised benchmark, referring to a defined commodity, delivery period, quality and price. A physical cargo, however, is specific. It has a particular location, shipment period, quality, storage position, freight requirement and counter-party terms. Basis is therefore the spread between cash and futures prices. It is the adjustment that connects the standardised futures market to the specific physical market. The basis is driven by four main factors: time, space, form and risk premiums.
Time: carry and convenience yield Time captures the economics of holding the commodity. If a trader owns grain today but sells it at a later date, the commodity must be financed and stored. This creates a cost of carry, including financing, storage, insurance and handling losses. These carry costs affect the basis because the holder of the grain must be compensated for keeping the physical commodity rather than selling it immediately.
Storage costs can vary between regions because infrastructure and financing conditions differ. For example, grain held in inland silos in Western Europe may be cheaper to store and finance, compared to grain already positioned at an export port facility. These carrying costs affect the basis because holding physical grain is not free. If traders expect higher futures prices, they may choose to store grain rather than sell it immediately. However, the expected price improvement must be large enough to cover storage and financing costs. If it is not, the local cash price may weaken relative to the futures contract. In this way, the basis reflects the cost of keeping grain in place until it can be sold or exported.
Time is not only about costs, but also convenience yield: the value of having immediate access to the physical supply when availability is tight, logistics are uncertain or replacement is difficult. Convenience yield affects basis because buyers may pay more for nearby physical grain when they need physical supply now. In this case, the cash market reflected the immediate scarcity more strongly than the futures market.
Space: geography and freight The space component reflects the economics of moving the commodity from where it is produced to where it is needed. Many bulk commodities tend to be seasonal and geographically unevenly distributed. This affects basis because a local cash price must include the cost of transporting from a surplus location to a deficit location.
In Europe, major grain production areas such as France, Poland and Germany often supply countries with less domestic production. For example, wheat produced in France may move by truck, rail or barge to export ports such as Rouen or La Pallice, and from there be shipped to other parts of Europe, Africa or Asia. These transport costs affect basis because grain at the farm is not worth the same as grain delivered to a port or consumption market.
Surplus regions typically have a weaker or negative basis relative to the futures benchmark, because the local cash price must discount enough to attract export demand. The Black Sea region, including Ukraine and Russia, is a clear example, where the local farm prices is significantly less than e.g. the MATIF futures price during harvest period because local capacity of transport to ports is a large port of the FOB price. Conversely, grain-deficit regions may experience a positive basis. For example, if China experiences a poor corn harvest due to adverse weather conditions, local demand for imported corn may increase. Importers may then be willing to pay a premium over international futures prices to secure the necessary supply at Chinese ports. This affects the basis because the local cash must rise enough to attract grain from alternative origins.
Additional logistics costs such as port handling fees, loading charges and insurance also influence the basis. For example, exporting grain from landlocked countries, e.g. like Hungary or Czech Republic, involves additional rail or barge transport to reach seaports, increasing the basis relative to e.g. MATIF futures. In importing countries, internal logistics costs, including trucking grain from ports to inland consumption areas, can significantly affect the local basis making the spot price higher than international futures prices. These frictions explain why basis is rarely "one number", because it is quoted by location, quality, timing and counterpart terms. Who the counter party is cannot be hedged away, thus the risk profile of a trade also heavily depends on whether a trader sold to a government entity or a private contractor as their terms and ability to enforce them vary significantly.
Form: quality and commercial terms The form component reflects the specific characteristics of the physical cargo and the commercial terms of the trade. Futures contracts are standardised, but physical grain is not. The physical cargo has characteristics that are more or less valuable. For example, grain that meets strict import requirements on e.g. protein content may command a stronger basis than grain that requires blending or special documentation.
Contract terms also affect basis because they determine which costs and obligations are included in the cash price. Under FOB terms, the buyer normally arranges and pays for ocean freight. Under CFR terms, the seller includes freight to the destination port. These terms affect basis because the quoted cash price must reflect what the seller is actually providing with a specific deliverable physical position.
Risk premium: residual uncertainty So to recap: Basis trading typically reduces exposure to large outright price moves, however, it does not eliminate risk. Instead, it shifts the type of risk being taken. Once the futures component has been hedged, the trader is mainly exposed to the relationship between the physical cash market and the futures benchmark. This risk is known as "basis riskBasis RiskThe risk that a physical exposure and its hedge do not move together because of differences in benchmark, location, timing, quality, vessel characteristics, contract terms, operations or counterparty performance.Open in terminology" and represents the potential for the cash-futures spread to change in an unfavourable way. Basis risk arises when the hedge does not match the physical exposure closely enough, or when the cash price and futures prices move differently after the hedge has been placed.
The main types of risk in basis trading are:
Price Basis Risk: cash and futures prices do not move in parallel.
Location Basis Risk: the physical commodity is located somewhere different from the futures contract's delivery point.
Calendar Basis Risk: the spot market selling date does not align with the futures contract expiry.
Product Quality Basis Risk: the commodity's quality differs from the futures contract specifications.
Freight and Logistics Risk: the actual costs of moving the commodity differs from the expected freight and logistics costs.
Operational Risk: the storage, loading, unloading or documentation issues create costs that were not fully reflected.
Counter party Risk: the cash counter party matters. If the hedge moves against the trader and the physical counter party defaults, the trader may face hedge losses without the expected cash-market offset, amplifying basis risk.
While the USD/mt numbers might seem modest, trading large volumes amplifies the financial impact. Consider a trader who buys 50,000 mts of wheat FOB Constanţa at USD 245/mt for shipment to Durban on a Supramax. The trader expects to sell the cargo CFR Durban at USD 295/mt. The expected freight cost is USD 40/mt and other costs are USD 6/mt. The expected margin is therefore:
So, the trader expects to make USD 4/mt. To reduce risk, the trader hedges two exposures: Firstly, the trader sells wheat futures at USD 248/mt to protect against a fall in wheat prices; Secondly, the trader buys Supramax FFA cover at USD 12,000/day, which the freight desk estimates equal to about USD 40/mt freight, to protect the freight exposure.
Later, the trader sells the cargo CFR at USD 300/mt. This looks better than expected because the wheat sale price is USD 5/mt higher than expected. However,the hedges and the physical costs have also changed, more specifically: The wheat futures have risen from USD 248/mt to USD 252/mt. Because the trader sold futures, this creates a futures loss of
The actual freight cost has also risen to USD 60/mt rather than USD 40/mt, because the physical route performs worse than the benchmark. However, the FFA benchmark used for the hedge rises only to USD 50/mt. As a result, the FFA hedge gains USD 10/mt, but this only partially offsets the USD 20/mt increase in the trader’s physical freight cost.
The final margin is:
On 50,000 mt, the trade loses:
This example shows why basis risk matters. At first glance, the trade looked profitable because the CFR sale price improved USD 5/mt. The trader also hedged the two obvious exposures: wheat price risk with futures and freight risk with FFA. However, the trade still lost money because the hedges did not perfectly match the physical exposure. The example contains freight and logistics basis risk, as well price basis risk.
This is why basis trading requires more than a view on general price direction. Options can limit flat-price risk, but they do not remove basis risk. Consider a trader who owns physical wheat but has not yet fixed the MATIF component of the sales price. Buying a MATIF put option sets a minimum value for that futures component if MATIF prices fall. However, the option does not protect the trader if the local cash price weakens relative to MATIF because of changes in location, timing, quality, freight, logistics or local demand. If the trader has already sold MATIF futures against the physical wheat, the flat-price exposure is largely hedged and buying a put would add a new options position rather than protect the basis. The remaining basis risk must therefore be managed separately through closer matching of the physical and futures positions, position limits and trade sizes that remain within the desk’s loss tolerance, including value-at-risk and stress-test limits. These controls are discussed in more detail in VaR Based Pricing
Cash trading
In basis trading, the cash trading represents the physical side of the position. It is the real exchange of physical commodities for cash payments Luc Nijs (2014). A local cash price is the price of a specific commodity at a specific place in a specific trading time window and under specific contractual terms. For example, a buyer may pay a certain price per metric tonne for wheat delivered FOB Odessa, Ukraine, during a defined shipment window. The cash price embeds "micro-details" that do not appear directly in futures price, such insurance costs, storage availability, and quality terms. This is why cash prices can differ from futures prices, which are the foundation of basis.
Cash trading is used when buying most types of commodities, such as wheat, corn and soybeans, as well as minerals and energy related products such as oil or fuel. Companies enter into cash commodity contracts to secure a specific good of a certain quality for a commodity they plan to use, effectively hedging against not only price fluctuations but operational efficiency. Wheat with a "wrong" protein content or oil with a "wrong" density and sulphur content might lead to production facilities to stop working. Therefore, the cash market can trade at a premium in case of scarcity or discount versus futures for certain types of commodities.
In freight, the equivalent cash markets is the physical freight market. A ship is fixed for a specific route and laycan window at an agreed rate, e.g. USD 45/mt, paid to the shipowner under a charter party. Just like a grain cash price, a freight cash price is specific. This is why freight also has basis: the actual voyage may not match the benchmark used for hedging FFA. If the ship is too long, too wide or does not have the right storage capacity, the economics of the deal change slightly for both the party hedging their exposure.
Not all cash trading involves physical delivery. A trader may buy a physical commodity with the intention of reselling it before delivery. In this case, there will be no physical goods change hands but only the monetary difference between contract and market prices is exchanged. They aim to buy a cargo at a low price and sell it at a higher price without ever taking delivery, or that futures value change relatively more in price than the cash price creating a profitable margin. However, this still creates physical-market risk when executed. If the trader cannot find a buyer at market price levels, the trader could be forced to either discount the cargo or become a CFR seller himself, with all the risk that entails, e.g. freight risk. Larger integrated trading companies often have more optionality because they can store, blend, ship or redirect cargoes. Smaller speculative traders may have less flexibility and are therefore more exposed to execution and liquidity risk.
For basis trading, the key point is that the cash leg contains the real-world features that make basis exist in the first place. Location, timing, quality, freight, storage and contract terms all affect the cash price. The futures market can hedge the broad benchmark price, but it cannot fully remove the physical specifications embedded in the cash trading.
Futures trading
If the cash trading is the physical side of basis trading, the futures trading is the benchmark side. A futures contract provides a standardised and liquid benchmark price against which local cash prices can be compared. This standardisation makes basis trading possible because it allows many different participants to trade the same futures contracts, even though the underlying physical commodity exists across many local markets Jonathan Kingsman (2000). Futures markets are useful in basis trading for three reasons Luc Nijs (2014):
Price Risk Management: they allow traders to hedge broad price risk and speculate on future price movements. This hedging ensures more predictable income and aids in financial planning, reducing flat-price exposure. The traders just have to focus more directly on whether the local cash price will strengthen or weaken relative to the futures benchmark.
Price DiscoveryPrice DiscoveryThe process by which market prices for agricultural commodities are determined based on supply and demand.Open in terminology: Futures markets aggregate information from numerous participants, reflecting collective expectations about future supply and demand. Because futures markets are liquid and react quickly to new information, they often move before local cash markets fully adjust. The futures price and the cash price may react to the same information at different speeds, leaving to potential change of basis.
Liquidity: Traders who speculate on price movements add liquidity to the market. While they assume risk, their activities facilitate smoother transactions for hedgers.
For agricultural commodities, the relevant futures benchmark depends on the region and commodity being traded. In North America, the Chicago Board of Trade (CBOT) contracts are widely used for corn, soybeans and wheat. In Europe, MATIF, now part of Euronext, is the French futures exchange specialising in agricultural commodities like wheat and rapeseed. For a European grain merchant, MATIF functions as the reference price, while local cash markets trade at premiums or discounts to this reference price, expressed locally as basis.
Future prices also influence physical decisions, such as when to sell, whether to store and where to supply. If futures prices for later months are higher than spot prices (a contango market), it may be profitable to store the commodity and sell it later. This can encourage traders to store grain if the price difference is large enough to cover financing and storage costs. Conversely, if futures prices are lower (a backwardated market), immediate sale might be preferable. These physical decisions affect local availability, export flows and freight demand for a commodity.
Freight then links futures markets to the physical basis. If futures prices indicate a forthcoming increase in corn exports, freight traders might anticipate higher demand for shipping services and secure price cover, either FFA or physical voyage charters, in advance. If freight increases in price, FOB cash export prices may weaken relative to futures as the net back economics for CFR buyers. The cash-futures relationship becomes mostly concrete near contract expiry, where contract specifications and delivery link futures prices back to the level of physical market.
Tender and Delivery
Tender and delivery are the mechanisms that connect a physically delivered futures contract to the physical cash market at expiry. In this context, tender is the seller's notice that they intend to deliver under the exchange rules, while delivery is the transfer of deliverable commodity, or title to it, to the buyer. In this way, the futures contract is not only a financial benchmark as it becomes a claim on physical supply near expiry.
This matters for basis trading because tender and delivery create the institutional link between the physical cash market and the futures market [EuronextMATIF]. The delivery mechanism helps prevent the cash-futures spread, or basis, from moving too far from each other as traders will buy/sell into the market to profit when they foresee a convergence at the end.
The key concept is convergence. In a physically delivered futures contract, convergence means that as the contract approaches expiry, the futures price should move toward the value of the deliverable physical commodity under the contract terms. The futures price and the cash price may diverge during the life of the contract, but as expiry approaches, they should not deviate too far apart if delivery is possible. If futures become too expensive relative to deliverable commodity, a trader with access to eligible physical wheat may sell futures and tender the commodity into the contract. If futures become too cheap relative to a deliverable commodity, a buyer may find it attractive to buy futures and take delivery instead of paying a higher cash price. These commercial flows help pull the futures and deliverable cash markets back toward each other.
This is why futures can serve as a hedge benchmark in basis trading. The futures price does not need to equal every local cash price. Rather, it must remain economically consistent with the value of the commodity that can satisfy the contract’s delivery terms. Tender and delivery therefore give basis practical boundaries and help traders judge when a local cash premium or discount has moved too far from the futures reference Craig Pirrong (2011).
Using the example of MATIF wheat, the delivery market represents the futures market where contracts can be settled through physical delivery. Tender and delivery impose economic boundaries on basis. At the futures delivery point, basis converges towards zero as expiry approaches. Away from the deliverable market, transport costs create a band around the futures benchmark: interior cash cannot remain far below futures once tendering becomes economical, and destination cash cannot remain far above futures once taking delivery becomes economical. Note certain assumptions on transport costs are necessary for decision makers shows that tender and delivery economics create floating upper and lower boundaries around the futures price, within which local basis can trade. The middle of the figure is the deliverable market, where basis tends towards zero at expiry. The barriers are floating as when the economics change (FOREX, energy costs, transportation cost, etc.) the room in which the barriers can change are different.
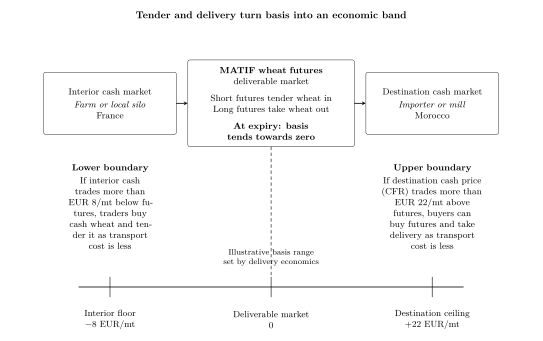
Tender and delivery impose economic boundaries on basis. At the futures delivery point, basis converges towards zero as expiry approaches. Away from the deliverable market, transport costs create a band around the futures benchmark: interior cash cannot remain far below futures once tendering becomes economical, and destination cash cannot remain far above futures once taking delivery becomes economical. Note certain assumptions on transport costs are necessary for decision makers
The interior market, such as local grain silos or farms, involves additional costs like transportation to the delivery location. These costs influence the basis, setting the economic lower boundary of the basis range. For instance, if transporting wheat from a farm in Northern France to the delivery point incurs a cost of EUR 8 per mt, the lowest the basis might go is EUR 8 per mt under the futures price as the trader can just buy from the farm and truck it to the delivery point. Any lower would create arbitrage opportunities, prompting traders to buy the cheaper physical wheat and deliver it against the futures contract for a profit, thereby correcting the price discrepancy. In other words tendering creates a "floor" on how cheap interior cash can become relative to the futures benchmark. Once the spread exceeds the cost to make delivery, delivery demand appears.
Conversely, the upper boundary of the basis range is established by the cost of sourcing wheat from the delivery market and transporting it to the destination market, such as a mill in Morocco. If it costs EUR 22 per mt to transport wheat from the approved FOB delivery silo to Morocco, the highest the basis might reach is EUR 22 per mt over the futures price. Beyond this, buyers would find it more economical to purchase futures contracts and take delivery themselves.
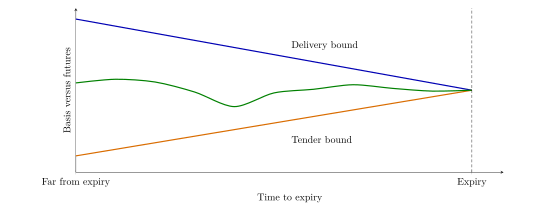
As expiry approaches, tender and delivery economics pull basis into a narrowing corridor around the deliverable market.
Tendering in this context refers to the action of delivering wheat to the futures market, sending the commodity to the delivery point specified by MATIF contracts. It signifies the lower end of the basis range, where selling to the futures market becomes a viable option for producers or traders. Delivery, on the other hand, involves taking possession of wheat from the delivery market, representing the upper end of the basis range.
Convergence ensures that at contract expiration the futures and cash prices align. It is worth noting that convergence is to the deliverable cash market, not to every local market. By knowing the costs associated with tendering and delivery, traders can establish value boundaries, manage risks and formulate effective trading strategies. They can decide on the timing, quantity and direction of their trades based on expectations of basis movements, ultimately enhancing their ability to capitalise on market opportunities in the dynamic agricultural commodity markets. These boundaries become practical decision rules discussed in the next section (Trading basis). As expiry approaches, tender and delivery economics pull basis into a narrowing corridor around the deliverable market. extends this logic by showing how the basis corridor narrows as expiry approaches.
Basis as a Trading Signal
Understanding typical basis levels and patterns for commodities is essential for informed market decisions. Basis is not only a spread between cash and futures prices; it is also a signal about local market conditions. The trading analysis can guide various trading choices in several ways.
First, basis analysis is to evaluate whether a price should be accepted or rejected. Once the futures price is known, the basis shows whether the local cash price is cheap or expensive relative to the benchmark given average conditions. A strong basis suggest that buyers are competing for supply, while a weak basis may indicate abundant availability, limited storage capacity or high logistics costs - or a mixture of all three. In some cases, it may be better to hedge price risk and wait for a more favourable basis rather than accepting an unattractive offer.
Second, basis patterns can help traders compare buyers or sellers. Different bids and offers often imply distinct basis levels, even when they refer to the same commodity. To compare them properly, traders convert each bid or offer into a basis against the same futures. This makes it possible to compare transactions with different buyers, sellers, or locations.
Third, basis analysis helps determine when to buy, sell, store or move physical commodities. By comparing the current basis with historical patterns, traders can as part of their trading analysis review whether the cash market in a historical context is strong, weak or broadly in line with normal prices and conditions. When inventory is scarce and immediate availability is valuable, the nearby physical market can strengthen relative to futures, while abundant supply or high carry costs can weaken basis. This information helps traders decide whether the market is rewarding immediate movement or whether it may be worth holding inventory.
Additionally, monitoring the basis is valuable for risk management. If the basis strengthens or reaches a desired target, a trader may decide to close a position if the trader believes there is no more upside. Unusual basis patterns occasionally create profit opportunities. Merchandisers and traders who actively manage basis levels need to remain alert to these irregularities, which can open avenues to enhance margins or avoid losses. Maintaining competitive bids and offers is vital when seeking to capitalise on such trends, thus favouring benefits of scale and regular volume.
How Freight affects Commodity Basis
Freight is a universal feature of commodity markets because production and consumption rarely occur in the same place. Wheat, maize, soybeans, sugar and vegetable oils all have to move from surplus regions to deficit regions, the same goes for iron ore, oil or fertiliser. For that reason, the basis is not only a reflection of local supply and demand, futures price, quality and timing, but also by the cost and difficulty of moving it to where it is needed.
This is how freight affects the basis. Basis is usually introduced as the difference between a local cash price and a futures price. That definition is useful, but it can make basis sound like a purely financial relationship. In physical commodity trading, basis is also geographical. It reflects the cost of connecting the location defined by the futures market with the location where the commodity is actually consumed.
Sugar can be used to try and illustrate this point. The ICE Sugar No. 11 futures contract governs the physical delivery of raw cane sugar on a FOB basis to the receiver's vessel at a designated port in the country of origin Intercontinental Exchange (ICE) (2023). The contract defines what can be delivered, including eligible origins, minimum quality, parcel size and delivery procedures. The special thing about sugar is that there are 29 designated deliverable origins, including major producers like Brazil, Australia, Thailand, India, and the United States. MATIF wheat by contract is only deliverable in France. Once sugar is delivered FOB, wherever that might be, the receiver must still move it to where it is needed.
An eligible delivery origin is therefore not automatically an equally valuable delivery origin. Sugar delivered in Brazil, Australia or Thailand may all satisfy the futures contract, but each origin creates a different delivered cost for the receiver when taking freight into account. Assuming freight from e.g. Thailand to Vietnam is cheaper than freight from Brazil, Thai sugar is therefore relatively more valuable due to its proximity to final use. Therefore freight, port access, vessel availability, congestion risk and more all affect what that sugar is worth in practice, as it determines the cost of bringing it from over supplied countries to under supplied ones. The freight clauses in Sugar No. 11 show how physical execution enters futures pricing. The contract sets rules for vessel nomination, minimum cargo size, load ports, draft, loading rates, laytime and demurrage. These details may appear operational, but they affect the economic value of delivery. A port that can only accommodate certain vessel sizes, loads slowly, or exposes the receiver to demurrage risk may be worth less than another eligible port. In physical commodity trading, any operational friction becomes economic friction.
The same logic applies to the short side of the futures contract. The seller wants to tender sugar from an origin where procurement, loading and delivery obligations can be met at the lowest cost. The buyer wants a delivery origin that can be moved onward efficiently. The futures contract defines the delivery mechanism, but freight determines the practical value of that delivery. This is why sugar basis trading is closely linked to origin, delivery options and geographical spreads, rather than only to the headline futures price.
A simple example can show this logic. Assume the Sugar No. 11 futures price is 20.00 cents per pound. This is roughly equivalent to about USD 441/mt. A buyer in North Africa can receive deliverable sugar from either Brazil or Central America. Both origins satisfy the futures contract, but they do not have the same delivered value. If freight from Brazil to North Africa is USD 35/mt, the freight adjusted cash value is USD 476/mt. If freight from Central America to North Africa is USD 55/mt, the freight adjusted cash value is USD 496/mt. The futures price is identical in both cases, but the delivered economics are not. For this buyer, Brazilian delivery is worth USD 20/mt more because it can be converted into a lower delivered cost.
This is the practical meaning of freight inside the basis. The exchange contract standardises the sugar, the delivery rules and the reference price. Freight determines whether a delivery origin is useful to the receiver. In basis terms, freight is the bridge between the futures price and the cash value of the commodity at destination.
Basis Trading in Key Commodities
Basis trading is a fundamental strategy used in various commodity markets, including but not limited to grains, sugar, cotton, oil and freight. Although these markets differ in their physical characteristics and their usage, the underlying principles of basis trading remain consistent. At its core, basis trading separates flat price exposure from relative value. Traders analyse factors such as supply and demand dynamics, transportation costs, storage fees and quality differentials to determine the basis. They use this information to make informed decisions that align with their risk management objectives.
Optionality in FOB-to-CFR trading presents a general framework of basis trading for commodities. The trader starts with an FOB origin value and compares alternative routes to convert that value into an executable delivered price. One route moves the commodity through space, by using freight to convert FOB into prompt CFR. Another route moves the commodity through time, by storing or delaying the sale into a later CFR value. A third value moves the commodity through form, by blending, processing or re-specifying the cargo into an alternative CFR value. The figure shows that basis trading is more than simply a comparison between cash and futures. It is also the comparison of route-created values against the benchmark or hedge, followed by execution of the route with the best basis or between executable physical alternatives, and about choosing the route gives the best basis or netback.
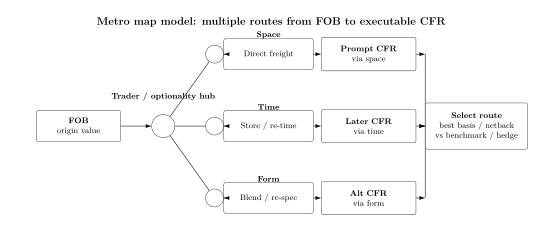
Optionality in FOB-to-CFR trading
However, the devil is in the detail and each market presents unique challenges and intricacies. Grain basis is often influenced by harvest cycles, storage capacity and inland logistics. Oil markets must account for refining capacity, infrastructure constraints, product specifications and geopolitical events. Freight adds another complication because shipping services are non-storable and freight rates can move quickly. Cotton traders must account for quality variation, international trade policy and demand from the textile and fashion industries. The basis exists in each market, but the strength of the cash-futures relationship determines how observable the basis is and how much basis risk remains.
Grains Grain markets provide the clearest starting point because wheat, maize and soybeans have well-established futures markets and relatively standardised contract specifications. Grain basis is influenced by local supply and demand, inland transportation costs, storage capacity, elevation margins, quality differentials and export competitiveness.
Using the Optionality in FOB-to-CFR trading framework, grain often moves through both space and time. The physical route reflects the cost of moving grain from farm or inland regions to domestic consumer, processor or export terminal. A strong export may pull grain toward ports and strengthen the basis. Weak export demand or high inland freight costs may leave grain trapped in surplus regions and weaken local basis.
The time route is also important because grain is seasonal and storable. During harvest, local supply increases sharply and storage capacity may become scarce, often weakening basis in producing regions. Later in the season, as stocks are drawn down and storage becomes more valuable, basis may strengthen. Grain merchants, farmers and exporters therefore use basis as both a pricing tool and a logistics signal. It tells them not only what the futures market is worth, but where grain is needed and when it should move.
Grain's basis is relatively observable because futures markets are liquid, harvest cycles are regular and transportation networks are well developed. This makes grain a useful benchmark for understanding basis trading before moving into more complex commodity markets.
Sugar The basis in sugar is more volatile and as shown previously, influenced by a wider array of factors compared to grains. Sugar trading requires a deeper analysis of origin-specific factors, delivery mechanisms and global trade dynamics.
Quality and Origin: Sugar quality can differ by origin, colour, polarisation (sucrose content) and other attributes. These differences create physical premiums or discounts that must be reflected in the basis, which are closely tied to the specific origin and quality of the sugar.
Delivery optionality: In sugar futures markets like the Intercontinental Exchange (ICE), the deliverer has the option to declare the origin and loading port after the contract expiration. It means the futures price often reflects the cheapest deliverable sugar and the basis can fluctuate based on the deliverer's choices. In grain markets, delivery locations and qualities are predetermined, leading to a more consistent basis.
Geographical Spreads: Sugar basis trading often involves trading geographical spreads due to differing freight costs and regional supply-demand imbalances. A cargo from Brazil, Central America or Asia may satisfy the futures contract, but each origin has a different delivered value thus basis. Sugar exports are more concentrated in certain origins and trade corridors, so geographical spreads can become a driver of basis.
Oil
Oil is the clearest example where time, space and form dimensions are actively traded. Oil basis is not built around one price, but around benchmarks, location differentials, calendar spreads and product spreads David Long (1995). Oil also differs from many physical commodity markets, because its basis risks can often be isolated and traded directly through liquid instruments.
Space basis arises from price differences between the same commodity at different geographic locations. For instance, the price of West Texas Intermediate (WTI) crude oil at Cushing, Oklahoma, may differ from Light Louisiana Sweet (LLS) crude oil on the U.S. Gulf Coast. An oil producer on the Gulf Coast selling LLS crude might hedge the price risk using WTI futures. However, since WTI and LLS trade at different prices the producer is exposed to locational basis risk, the risk that the price difference between LLS and WTI will change unfavourably. To mitigate this the producer can use a basis swap that specifically hedges the price differential between the two locations, thus managing the space basis risk.
Time basis, or calendar basis, refers to the price differences between oil contracts with different delivery dates. In oil futures markets this is observed in the term structure of prices, where the market can be in contango which means that future prices are higher than spot prices, or backwardation where future prices are lower than spot prices. For example, a refiner expecting to purchase crude oil in three months might face uncertainty about future prices. To hedge this risk they can engage in a calendar spread by buying futures contracts for the desired delivery month and simultaneously selling contracts for a different month. This strategy locks in the price differential between the two periods, allowing the refiner to manage exposure to price fluctuations over time.
Form basis refers to price discrepancies due to differences in the quality or specifications of oil products. Crude oil varies in terms of density, sulphur content, API gravity and other characteristics that affect its value and refining costs. Similarly, refined products like gasoline, diesel and jet fuel have different market dynamics and pricing. For example, an airline hedging jet fuel costs might use heating oil futures due to the lack of liquid jet fuel derivatives, but this substitution introduces product basis risk because, although both products are middle distillates and their prices are correlated, heating oil prices may not track jet fuel prices exactly. Traders manage this form basis risk by using swaps or options that more closely match the specific product, or by accepting some basis risk in exchange for greater liquidity in the hedging instrument.
Oil basis trading therefore requires attention to benchmark selection, infrastructure constraints, storage economics and product specification. It shows the full basis framework in a highly developed form arguably far ahead of most other commodity markets.
Cotton Let us look at a commodity that is slightly different. Basis trading is still applicable and widely used, but the product itself is different from oil. In cotton markets, the quality of the commodity, i.e. the fibre characteristics matter directly for value. Staple length, strength, micronaire, colour and contamination all affect spinning performance and fabric quality. Cotton is therefore priced first as a technical input cost to a production. However, recently clothing sellers have seen cotton as a differentiator in their marketing. Once it enters apparel, origin, production method and certification can become commercially valuable. Organic, regenerative or traceable cotton may command a premium even when its functional quality is close to conventional cotton. Organic cotton from a farm where the label is worth more than the lint may command a premium over conventional cotton, even when its functional quality is similar, because it gives the brand a story to sell.
This makes cotton different from bulk commodities such as oil or corn. In those markets, quality mainly reflects industrial use. In cotton, value combines physical utility with identity, documentation and trust. For traders, preserving that identity through segregation, certification and traceability becomes part of protecting the premium.
Firstly, quality variability is more pronounced in cotton than in grains. Cotton is graded based on factors such as fibre length, strength, colour and cleanliness, leading to a wide range of quality grades. These quality differences directly impact the basis because higher-quality cotton commands a premium, while lower-quality cotton trades at a discount. They also affect whether cotton is deliverable against the futures contract or acceptable to a textile mill. A bale may exist in the market, but if its grade does not match the delivery requirements, its value can diverge sharply from the futures benchmark. This gives cotton basis risk a larger quality-and-deliverability component than many grain markets.
Secondly, cotton is less perishable and can be stored for longer periods without significant degradation. As a result, cotton basis is not usually dominated by harvest pressure in the same way as grain basis. Carrying costs matter, but quality preservation and the timing of mill demand are often more important.
Additionally, cotton demand is closely tied to the textile industry and global fashion trends, which can be cyclical and influenced by economic conditions. A change in mill margins, consumer demand or textile trade flows can alter the value of specific grades, even if the futures market moves only modestly.
Biomass
In biomass markets such as wood pellets and wood chips, basis trading is structurally harder than in grains, oil, metals or freight because the physical product lacks a liquid futures market. There is no deep screen price, no standard exchange contract and no reliable curve against which traders can continuously mark positions. A commercial basis still exists, but it is not quoted in the same way as a wheat basis to Matif or a freight basis to an FFA route.
Wood pellets can be valued as an energy input for power plants. Their economics may be compared with gas, power, coal, carbon and renewable subsidy regimes. However, this does not mean that a pellet position can be cleanly hedged with gas futures. Gas is a competing energy reference, not a direct hedge. The wood pellet price contains risks that gas futures do not capture: fibre supply, drying costs, plant outages, sustainability certification, storage losses, moisture, calorific value, port handling, inland logistics, ocean freight, counterparty performance and regulation. Therefore, the pellet-to-gas spread is observable as an economic relationship, but it is difficult to trade, price or hedge as a standard financial spread.
The consequence is that biomass markets manage risk through contract design rather than exchange hedging. Instead of quoting a transparent basis to a liquid futures benchmark, the market embeds the basis inside bilateral contracts. Fixed-price term contracts, index-linked formulas, freight pass-throughs, quality adjustments, take-or-pay clauses, volume tolerance, sustainability clauses, credit terms and long-term supply agreements become the main risk-management tools. In other words, the biomass basis is not traded on a screen; it is negotiated into the physical contract.
This has kept the market more contractual, less transparent and less liquid than comparable energy and agricultural commodity markets. In a liquid market, a trader can buy physical product, sell a futures contract, monitor basis exposure and exit the position if risk limits are breached. In biomass, that mechanism is weak. Positions are often bilateral, bespoke and difficult to unwind. The trader may know the commercial logic of the position, but the risk department may still struggle to verify the mark-to-market, estimate volatility or observe a reliable exit price.
This matters because larger trading houses run formal risk systems. They allocate capital through position limits, stress tests and Value at Risk models Craig Pirrong (2015). These models need observable price history, liquidity assumptions and hedge correlations. Biomass often fails this test. If a wood pellet cargo cannot be marked against a liquid futures curve, and if there is no reliable hedge to offset the exposure, the model either assigns a punitive risk charge or refuses to recognise the hedge value. The commercial desk may see an attractive margin, but the risk system sees illiquid directional exposure.
Therefore, larger traders often need to structure biomass trades in one of three ways. First, they can execute back-to-back business, buying from a supplier only when the sale to a consumer is already secured. This reduces price exposure but also reduces trading optionality. Second, they can keep positions small enough that the unhedged risk does not break internal VaR limits. This protects the balance sheet but prevents meaningful scale. Third, they can use long-term contracts with matched purchase and sale obligations, where the margin is locked through contract structure rather than through futures hedging. This turns the trader into a supply-chain coordinator more than a basis trader.
The result is a self-reinforcing liquidity problem. Because the market is illiquid, large traders are reluctant to warehouse risk. Because large traders do not warehouse risk, the market remains illiquid. Without active intermediation, there are fewer forward prices, fewer standard contracts and fewer observable spreads. Price discovery remains private, fragmented and relationship-driven.
Biomass trading is therefore not the absence of basis risk. It is basis risk without a clean hedging instrument. The market does not normally hedge wood pellets by selling gas futures and treating the residual as a standard spread. Instead, it controls exposure through bilateral matching, conservative position limits, credit discipline, quality clauses, freight terms and long-term physical agreements. The trader’s skill is not only to forecast price direction, but to structure the contract so that the unhedgeable basis remains small enough, measurable enough and profitable enough to fit within the firm’s risk framework.
Market Participants
Commodity and freight markets are dynamic arenas where various participants trade, hedge and manage the movement of physical commodities across global supply chains Jonathan Kingsman (2000). These markets facilitate the exchange of essential commodities like wheat, corn, soybeans, biomass, energy, metals and other bulk commodities. For each commodity, price formation is closely linked to logistics, freight, storage, quality and timing. Understanding who is active in these markets is crucial for grasping how they function and how prices are determined. The participants can be broadly categorised into either physical participants or financial participants. The distinction is useful, but it is not always clean. A large trading house may trade physical commodities, hedge futures, manage freight exposure and use derivatives at the same time.
As some are hedgers, some are trading flat price and others are trading basis, different market participants care about different risks. Some mainly care about the flat price, while others may be more concerned about quality, logistics or location. This diversity of motives is what makes commodity and freight markets interconnected.
Physical Participants Physical participants are entities directly involved in the production, processing, transportation or consumption of agricultural commodities. They use the futures and options markets primarily for hedging purposes to manage price risk. They buy and sell real commodities in real locations, so they heavily depend on basis.
Farmers and other producers: They produce commodities and are exposed to price risks associated with market volatility. In agricultural markets this includes producers of wheat, maize, soybeans, sugar cane, or oilseeds. In other commodity markets it may include miners, energy producers, biomass suppliers or industrial raw material producers.
Cooperatives: Groups of producers may band together to collectively increase their combined volumes and through that leveraging better terms and market access.
Multinational Trading Companies: These organisations operate globally, handling large volumes of commodities. They facilitate the movement of goods from producers to consumers, having access to and offering solutions within financing, logistics and risk management that smaller companies cannot.
Specialised Trading Firms: Some firms focus on specific commodities or regions, providing expertise and market access that might be challenging for smaller producers or consumers to achieve independently. Their advantage often comes from local knowledge, customer relationships, operational expertise or the ability to solve logistical problems that larger firms may overlook.
Refinery or Processing Companies: Businesses that require raw commodities as inputs for their products hedge against price increases to stabilise production costs.
Manufacturers and Retailers: Entities further along the supply chain may also participate in the markets to manage their input costs and ensure steady supply.
Charterers, Shipowners and Freight Traders: These participants provide or procure transportation services. Charterers need vessels to move cargoes, while shipowners provide carrying capacity. Freight traders may take positions in cargoes, vessels or freight derivatives. Their risks include freight rates, bunker costs, port delays, demurrage, vessel availability and route-specific demand.
Financial Participants Speculators are traders who seek to profit from price fluctuations in the commodity and freight markets without any intention of taking physical delivery of the goods. They provide liquidity and are essential for efficient market functioning. By providing liquidity in futures, they also make it easier for commercials to hedge. Their focus is often on price movements, spreads, volatility, correlations and portfolio allocation rather than physical execution.
Managed Funds and Commodity Trading Advisors (CTAs): These are professional money managers who handle large pools of capital on behalf of clients. They employ sophisticated trading strategies, often using technical models or computer algorithms to make trading decisions. CTAs are regulated entities that must adhere to specific reporting requirements. They rarely engage in physical basis.
Hedge Funds: Unlike traditional funds, hedge funds may take larger, more aggressive positions in the market. They can engage in both speculative and arbitrage trading, sometimes even taking physical delivery of commodities to exploit price discrepancies.
Commodity Index Funds: These funds invest in a basket of commodities to replicate the performance of a commodity index. They attract institutional and retail investors interested in diversifying their portfolios.
Regulation of Markets
Regulatory oversight is fundamental to maintaining the integrity, transparency and fairness of financial markets. For basis trading, regulation matters because basis depends on trust in price signals. A basis trader compares a physical cash price with a reference price, often from a futures market, index or broker assessment. The more transparent and reliable those reference prices are, the easier it is to judge whether a basis movement reflects genuine conditions.
Commodity futures markets are built around this need for transparency in order to function properly. Futures contracts for agricultural products, metals and energy commodities, are supervised by regulatory bodies such as the U.S. Commodity Futures Trading Commission (CFTC). Regulators monitor trading activity, investigate manipulation and enforce rules on market conduct. Transparency is enhanced through regular reports like the Commitment of Traders (COT), which breaks down the positions held by different types of traders, commercials, non-commercials and non-reportable, helping market participants make informed decisions.
A key feature of commodity futures markets is the use of central clearing houses. All futures contracts are cleared through these entities, which act as intermediaries between buyers and sellers. The clearing house guarantees the performance of the contract, reducing counterparty risk, but at a cost. Participants must post margin, and positions are marked to market daily. Standardised contract terms also support liquidity because participants know the quantity, quality, delivery procedures and financial obligations attached to the contract. For basis traders, this matters because the futures leg of the trade is relatively transparent, standardised and financially secure.
Cash freight markets operate differently. The freight market has traditionally operated on relationships, bilateral negotiation and proprietary information. To this day, most freight transactions are negotiated bilaterally between charterers, shipowners and freight traders via ship brokers. These deals are often relationship-driven, customised and based on information that is not publicly available. This is because freight contracts need to reflect specific vessels, cargoes, ports, laycans, loading rates, demurrage terms or operational risks. However, it also means that price discovery is less transparent than in exchange-traded futures markets.
The treatment of information is one of the clearest differences. In regulated commodity futures and securities markets, insider trading is illegal and subject to severe penalties because it undermines market integrity and investor confidence. In cash freight markets, proprietary information is often part of the trading edge. Freight trading has historically operated through networks, relationships and private information, so information advantages are treated differently from insider trading in securities or regulated futures markets.
These differences underscore the importance of understanding the regulatory frameworks governing different markets. Participants in freight markets must exercise greater due diligence and implement robust risk management practices to navigate the complexities arising from limited oversight. As global trade continues to evolve there may be calls for increased regulation in freight markets to enhance transparency and protect participants, balancing the need for flexibility with the imperative of market integrity.
The European energy crisis of 2022 led European Union member states to agree a market correction mechanism for certain gas derivatives. The mechanism was intended to limit extreme benchmark prices rather than cap the retail price paid by consumers. The agreement set a headline threshold of EUR 180 per megawatt-hour and was due to apply from 15 February 2023. This example shows how regulators may intervene when benchmark prices are judged to threaten market stability, while such intervention can also affect liquidity, price formation and market incentives Novaya Gazeta Europe (2022).
However, such price caps can inadvertently affect consumption patterns. By capping prices, consumers may have less financial incentive to reduce their gas usage, potentially maintaining or even increasing demand in constrained markets. This sustained demand, particularly for Russian gas, can contribute to persistently high market prices. Furthermore, elevated energy costs have been linked to a decline in the competitiveness of European manufacturing. Industries faced increased production expenses, leading to reduced output and, in some cases, the relocation of operations to regions with more favourable energy costs. The interplay between price caps, consumer demand, and industrial competitiveness highlights the complexities policymakers must navigate when addressing energy crises. Balancing consumer protection with market stability and economic vitality remains a critical challenge in formulating effective energy policies.
Financial Architecture of Freight Trading
Freight Basis Trading
Freight basis trading begins from a simple but important difference compared with many physical commodities: freight is perishable capacity. Grains can be stored and sold later, but an unused vessel day disappears once the day has passed. This changes the economics of basis. In freight, there is no inventory mechanism. The market adjusts through vessel utilisation, speed, congestion, ballast decisions and repositioning. Basis therefore reflects not only the current spread, but also expectations about future vessel earnings and the opportunity cost of using a ship on one employment rather than another.
Modern freight markets operate through two connected layers. The first is the physical chartering market, where ships are fixed for specific voyages, routes, cargoes and laycans. The second is the paper freight market, where exposure to future freight rates is traded through indices and Forward Freight Agreements (FFA). The physical market is negotiated around a specific vessel, route, cargo, laycan and charter-party terms; the paper market is standardised and index-linked. In practice, a physical voyage and a financial hedge are never exactly identical. The hedge can move in the right direction, while still failing to capture the exact economics of the physical voyage. When it comes to economics, the realised margin of a voyage depends not only on the headline freight rate, but also on how the voyage performs. Bunkers, canal costs, port charges, carbon costs, waiting time, weather routing, speed, consumption and vessel performance can all change the final margin. These costs become basis risk when they affect the physical voyage differently from the benchmark used for the hedge. A professional freight trader must therefore ask two questions: does the index match the voyage, and does the voyage perform as expected?
It is also worth-noting that the relationship between the physical route and the benchmark may change over the hedged period. Route basis is therefore rarely constant over time. Differences in local cargo demand, vessels supply, weather conditions, port congestion and regional vessel positioning can cause the spread to widen or narrow and may generate recurring seasonal patterns. Illustrative monthly route basis for a Time Charter trip from region A to region B on a Handysize vessel across four years. Basis is the physical route time charter equivalent less the relevant Baltic Handysize benchmark, measured in USD/day. Positive values indicate a route premium to the benchmark, while negative values indicate a discount. The common monthly shape represents recurring seasonality, while the differences across years represent market conditions specific to each year. illustrates the broad monthly shape of route basis is similar across the four years, while its level and amplitude vary from year to year. Historical seasonality can therefore help traders form expectations about future basis movements, but it should not be treated as a mechanical forecast.
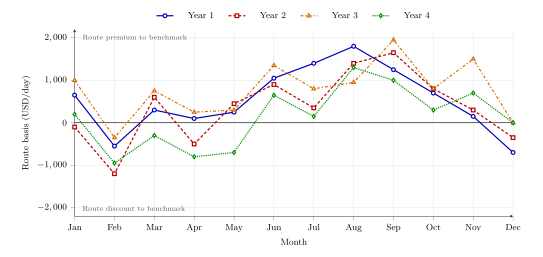
Illustrative monthly route basis for a Time Charter trip from region A to region B on a Handysize vessel across four years. Basis is the physical route time charter equivalent less the relevant Baltic Handysize benchmark, measured in USD/day. Positive values indicate a route premium to the benchmark, while negative values indicate a discount. The common monthly shape represents recurring seasonality, while the differences across years represent market conditions specific to each year.
Baltic Exchange Freight Indices
Before turning to the details of freight trading, it is useful to first introduce the freight indices on which these instruments depend. Futures markets require standardised settlement benchmarks and freight markets are represented by several index providers. However, for dry bulk and tanker freight derivatives, the Baltic Exchange Indices remain the dominant settlement benchmarks. This section therefore focuses on Baltic Exchange freight indices, particularly those most relevant for commodity supply chains and the FFA discussed below.
The Baltic Exchange itself has a long history. It originated in 1744 at the Virginia and Baltic Coffee House on Threadneedle Street near London’s Royal Exchange, where merchants, shipowners and brokers gathered to exchange market information. It was incorporated as a private limited company owned by its members on 17 January 1900. In November 2016, the Singapore Exchange acquired the Baltic Exchange, which continues to operate from London. While this history reflects the evolution of global maritime trade, its modern relevance lies in providing standardised freight benchmarks that support financial hedging. The Baltic Exchange publishes a comprehensive range of freight benchmarks across both the dry bulk and tanker markets. In dry bulk shipping, the principal indices include the Baltic Dry Index (BDI), together with vessel-specific time-charter averages such as the Baltic Capesize Index (BCI), Baltic Panamax Index (BPI), Baltic Supramax Index (BSI) and Baltic Handysize Index (BHSI), as well as individual voyage route assessments. These benchmarks are particularly relevant for agricultural commodities, coal, iron ore, fertilisers and other bulk cargoes. In the tanker market, the Baltic Exchange publishes benchmarks for both crude and refined petroleum products, including the Baltic Dirty Tanker Index (BDTI) and Baltic Clean Tanker Index (BCTI), together with their underlying route assessments. These indices translate fragmented physical freight markets into standardised reference prices, making it possible to trade, hedge and settle freight exposure financially.
FFA rely on these benchmark indices for settlement. This means that the quality, representativeness and interpretation of the underlying index directly affect the effectiveness of the hedge. If the index closely tracks the physical exposure, the hedge performs well. If the index diverges from the actual freight exposure, basis arises. For basis trading, this abstraction matters in several ways. First, the index route weightings may not correspond exactly to actual trading activity. The Capesize 5TC Average Index, for example, assigns weights to selected benchmark routes. Similar weighting structures apply to Panamax, Supramax and Handysize indices. These weights do not necessarily reflect the actual volumes traded on each route at any given time. Although index compositions are periodically reviewed and adjusted, changes in physical trade patterns may occur faster than index revisions. As a result, some routes may be over-represented while others are under-represented. A trader whose physical exposure differs from the index composition is therefore not only exposed to freight price risk, but also to the residual risk between the traded route and the benchmark index.
Second, Baltic freight indices are compiled from broker assessments rather than from a complete set of cleared transactions. This is necessary because freight markets are negotiated, discrete and often relatively thin volume compared with continuously traded financial or commodity markets. Broker assessments bring expert market judgment into the index process, but they also mean that the index is not a pure transaction-price average. This assessment mechanism can also make the index more sensitive to market concentration. In routes or periods where spot fixtures are limited, market information may be concentrated among a relatively small number of brokers and participants. Individual fixtures, assessments or market views can therefore have a larger influence on perceived freight levels. The Baltic Exchange has taken steps over time to strengthen its methodology and governance, but the assessed and discrete nature of freight markets remains an inherent feature of the system.
For basis trading, this creates a potential basis risk, but they may also create trading opportunities for participants who can judge whether the divergence between the index and the physical market is temporary, structural or tradable. Illustrative example of how to think about different markets presented by market on an ordinal radar scale. Each axis is scored as low, medium, or high. Oil scores medium on volatility, high on market size, and low on capture ability. Freight scores low on volatility and market size, but high on capture ability. The shaded areas summarise relative position across axes; they are not estimated profit surfaces. Note that some freight markets can be more volatile than oil, and vice versa. positions freight against oil on an ordinal opportunity scale, illustrating why freight may offer a smaller market size but potentially higher capture ability. Put differently, freight basis trading raises the question: would one rather be a big fish in a small pond, or a small fish in a big pond?
All of this might read negatively for some, while others might read it as an opportunity. If you have an edge in a market like this, you might reap disproportionate profits. Illustrative example of how to think about different markets presented by market on an ordinal radar scale. Each axis is scored as low, medium, or high. Oil scores medium on volatility, high on market size, and low on capture ability. Freight scores low on volatility and market size, but high on capture ability. The shaded areas summarise relative position across axes; they are not estimated profit surfaces. Note that some freight markets can be more volatile than oil, and vice versa. compares freight and oil across three dimensions that jointly influence trading opportunity: volatility, market size and capture ability. The figure uses an ordinal radar scale, with each axis scored as low, medium or high from inside to outside. Oil scores medium on volatility, high on market size and low on capture ability, reflecting a large and liquid market where pricing discrepancies are more visible and more quickly arbitraged away. Freight scores low on volatility and market size, but high on capture ability. The implication for basis trading is that freight may offer fewer opportunities in absolute market size, but greater scope to capture specific mispricing or basis divergence. Its less standardised, less liquid and more information-intensive structure rewards traders who understand the physical market, route dynamics and index construction.
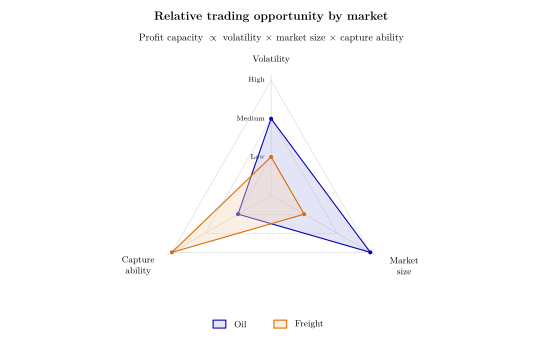
Illustrative example of how to think about different markets presented by market on an ordinal radar scale. Each axis is scored as low, medium, or high. Oil scores medium on volatility, high on market size, and low on capture ability. Freight scores low on volatility and market size, but high on capture ability. The shaded areas summarise relative position across axes; they are not estimated profit surfaces. Note that some freight markets can be more volatile than oil, and vice versa.
Forward Freight Agreement
Having established the freight basis trading framework, we can now turn to the instrument that makes freight rate risk tradable: the Forward Freight Agreement, or FFA. An FFA is a cash-settled freight derivative linked to a published freight index. It does not move a ship or a cargo. Instead, it allows market participants to exchange an uncertain future freight rate for a fixed benchmark price. In economic terms, this is the key service an FFA provides: it separates the physical act of transporting cargo from the financial risk created by changes in freight rates.
That separation matters because freight is a derived price formed in a volatile physical market, where rates move with changes in shipping demand and vessel supply. In such a setting, shipowners are exposed to uncertain future earnings and charterers are exposed to uncertain future transport costs. The FFA allows both sides to transfer that flat price risk into the paper market without changing their physical trading strategy. A shipowner can stabilise revenues, a charterer can protect a freight budget, and a trader can hedge flat price freight exposure embedded in a CFR cargo sale. The economic gain is better risk sharing: the party that needs freight exposure does not have to keep all of it, and the party willing to bear price risk can take it on.
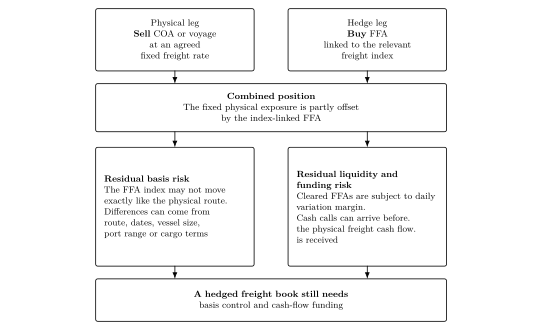
An FFA hedge structure.
An FFA hedge structure. shows this structure. The physical leg may be a fixed voyage, such as a COA or a voyage sold at an agreed fixed freight rate. The hedged leg is an FFA linked the relevant freight index. Combined, the fixed physical exposure is partially offset by the index-linked FFA. If freight rates rise or fall broadly in line with the index, the hedge helps reduce the benchmark exposure created by the physical leg. However, the figure also shows why an FFA hedge does not eliminate risk. First, the FFA index may not move exactly like the physical route as discussed in the previous section. Second, residual liquidity and funding risk remain because FFA are margined daily. A hedged freight book still needs both basis control and cash-flow funding.
FFA also improve price discovery and make hedging more practical because they translate a messy physical market into standardised financial exposures. At expiry, counterparties settle financially against the published index rather than through the delivery of a vessel. If the market settles above the agreed FFA price, the buyer receives the difference. If the market settles below the agreed FFA price, the seller receives the difference. That is why FFA are the foundation of freight basis trading: they turn uncertain future freight rates into transferable cash flows that can be priced, hedged, and managed separately from the voyage itself.
FFA Options
FFA options are another tool for managing freight rate exposure. An option gives the holder the right, but not the obligation, to receive protection if the benchmark move beyond a strike price. A call option protects against rising freight rates, while a put option protects against falling freight rates.
Freight options and their usage shows the commercial logic of FFA options. A charterer who worries about rising freight costs can buy a freight call, which sets a ceiling on the benchmark freight cost. If freight rates rise above the strike, the option gains value and helps offset the higher freight market. If freight rates fall, the charterer can let the option expire and benefit from cheaper freight, losing only the premium paid. A shipowner faces the opposite exposure. A shipowner who worries about falling earnings can buy a freight put, which acts as a floor under the benchmark earnings. If freight rates fall below strike, the option gains value and helps offset weaker earnings. If rates rise, the shipowner can let the option expire and enjoy the stronger spot earnings.
In both cases, the option creates asymmetric payoff. The option buyer pays a premium to limit the downside risk while keeping exposure to favourable price moves. In a basis context, that matters because many traders do not want to neutralise every source of variability. This is also the key difference between an FFA and an option. An FFA creates a more linear hedge against the benchmark risk, where gains and losses move directly with the settlement index. An option, by contrast, protects against adverse benchmark moves while preserving flexibility. The premium is the price of flexibility paid to the writer for bearing nonlinear freight volatility. It is worth noting, however, that an FFA option protects the benchmark, not the exact physical voyage. If the voyage differs from the index because of route, timing, vessel position, port conditions or performance, residual basis still remains.
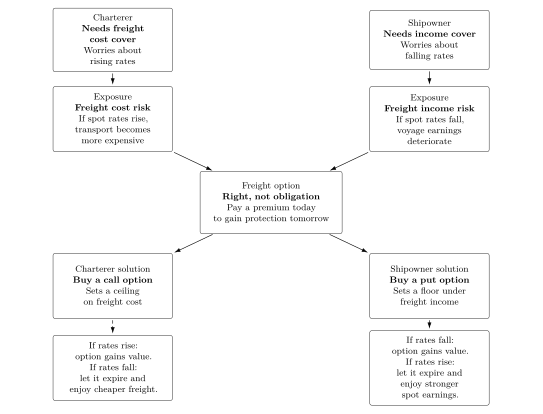
Freight options and their usage
A simple freight case shows how this works. Assume a charterer expects to have floating freight exposure linked to a Panamax benchmark. The charterer's internal freight budget is USD 14,000 per day. To protect against a stronger market, the charterer buys a USD 15,000 per day FFA call. The premium is USD 400 per day. During the settlement month, the relevant Baltic average settles at USD 18,000 per day.
The option now has a positive payoff because the settlement index is above the strike price. The call pays the difference between the settlement price and the strike:
After deducting the premium of USD 400 per day, the net option gain is:
Now compare this with the charterer's budget. The benchmark moved from the budget level of USD 14,000 per day to USD 18,000 per day. Without the option, this would have created a USD 4,000 per day adverse benchmark move. The option reduces this benchmark loss by USD 2,600 per day. The remaining benchmark cost increase is therefore:
The charterer has therefore not locked freight at USD 14,000 per day. Instead, it has bought protection above USD 15,000 per day, by paying USD 400 per day for that protection. In benchmark terms, the option reduces the impact of the stronger market, but it does not eliminate it completely.
The final step is to separate the benchmark from the physical voyage. Suppose the actual voyage costs USD 18,700 per day because the vessel is poorly positioned, loading is slow, or the route carries extra port risk. The remaining USD 700 per day gap is residual basis:
This is why an FFA option should be understood as benchmark insurance, not physical freight insurance.
The example shows the payoff once the option has settled. Before expiry, however, the option value is not fixed. it changes as market conditions change. A call becomes more valuable when the benchmark rises towards the strike, because the protection is more likely to be needed. If the benchmark moves above the strike, the call already has a positive payoff. A put option works in the opposite direction. It becomes more valuable when the benchmark falls towards or below the strike. Time also matters. The longer the period before settlement, the more opportunity there is for the freight rates to move beyond the strike. An option with several months left to expiry will normally be worth more than the same option close to expiry. Volatility also strengthens the value of both calls and puts. Higher volatility means that freight rates move far away from today's level in either direction. For a call buyer, this increases the chance that the benchmark rises above the strike. For a put buyer, it increases the chance that the benchmark falls below the strike. The buyer benefits from favourable larger moves while the downside on the option itself is limited to the premium.
One freight-specific feature is that many FFA options are average-price, or Asian, options. All things else equal, their payoff depends on the average Baltic index assessment over the relevant settlement month, rather than one single final price. This matters because averaging smooths daily rate movements. All else equal, an average-price freight option is generally cheaper than comparable plain-vanilla European options, because one extreme daily move has less influence on the final payoff. This fits freight markets, where options settle financially against index assessments rather than through physical delivery of a vessel.
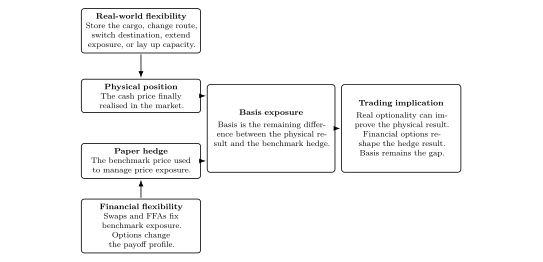
Financial and real optionality in freight basis trading
An FFA option is a financial contract written on a freight benchmark. This should be separated from real optionality, which refers to operational choices embedded in a vessel, charter party or logistics position. In shipping, examples include wide redelivery window in time, wide geographical redelivery limits, or the option to extend a time-charter against a fixed rate agreed. Financial and real optionality in freight basis trading shows this distinction. Real-world flexibility affects the physical position and can improve the cash result. Financial flexibility affects the paper hedge. Together, both forms of flexibility reshape the payoff, while basis exposure remains between the two that must still be managed.
Strategies for Freight Trading
FFA Usage: A Freight Trader's Perspective
Having introduced the mechanisms of FFA, we now turn to how FFA are used from a freight trader's perspective. In this context, a freight trader may include a charterer, commodity trader or freight desk that combines cargo commitments, vessel carrying capacity and paper positions. The central question for the freight trader is not only how to reduce risk, but also how to create value from changing market conditions.
FFA do not create value on their own. Their business value lies in how they reshape the risk profile of an existing or intended physical position. By integrating FFA into their portfolio, freight traders can expand their trading options from simply trading "cargo x vessel" to more complex combinations involving "cargo x vessel x FFA". In the simplest physical market, the trader mainly compares four relative positions: buying cargo, selling cargo, buying vessel tonnage or selling vessel tonnage. Once FFA are added, the trader can also combine these physical positions with long or short paper positions, creating nine trading configurations. This offers trading team multiple avenues to capitalise on market inefficiencies, ultimately driving better performance and unlocking more value within the freight markets.
From this perspective, FFA support four broad commercial decisions. First, they help traders protect the margin of vessel positions that have already been fixed. When a trader charters a vessel on a fixed-rate period contract, the trader faces significant flat price risk due to the predetermined rate. The charter may become expensive relative to the market if freight rates fall. By selling FFA against this exposure, the trader offsets market-wide movements in freight rates. If the market declines, losses on the physical hire may be compensated by gains on the FFA; if the market rises, the FFA loses but the vessel earns more. In either scenario, FFA ensures a fixed price despite market volatility.
Second, FFA allows traders to support forward freight sales and Contracts of Affreightment (COA) commitments before the final execution cost is known. When selling freight or entering COA, the trader may commit to a fixed sale price while the future costs of securing vessel carrying capacity remains uncertain. The trader wants to win cargo business today without being fully exposed to future increase in freight price. In this case, the trader typically sells physical freight and simultaneously buys FFA. This approach prevents being solely short the market and allows for effective hedging by balancing exposure with forward contracts.
Third, FFA help traders transform the pricing structure of an exposure. For floating-rate or index-linked period charters, hire payments move directly with the Baltic Index. This avoids being locked into a fixed hire rate, but it leaves the trader with floating cost exposure. The business problem is that revenues and costs may be priced differently: for example, the trader may have fixed freight income but index-linked vessel costs. By buying FFA, the trader can effectively fix the floating hire exposure into a fixed economic cost. If the index (floating hire) falls, the physical hire decreases which saves the trader money on hire, but the FFA position loses value: if the index rises, hire increases, but the FFA hedge gains value. The purpose is to align the pricing structure of vessel exposure with the trader's commercial commitments.
Fourth, FFA create relative-value and basis trading opportunities. In this case, a freight trader may buy/sell freight for tonnage or cargo based on specific market views. For instance, if anticipating a decline in flat freight prices while observing attractive basis levels from sellers, the trader can speculatively buy freight rates and sell FFA. This strategy locks in the spread between the cargo rate and the FFA, securing potential profits if freight rates or indices decrease as expected. This approach carries risks, as unexpected increases in freight rates could expose the trader to losses.
Across these four cases, the underlying logic is consistent. Freight traders create value by reshaping commercial exposure. What changes is the initial commercial problem: protecting a charter position, supporting a freight sale, aligning pricing mechanisms, or trading a market discrepancy. This is why FFA should be understood not only as hedging instruments, but as strategic tools that expand the commercial possibilities available to freight traders.
Basis Management: A Shipowner's Perspective
The previous section examined how freight traders create value through FFA. Shipowners face a different but related challenge. Rather than starting from cargo commitments or trading opportunities, they begin with an existing fleet whose earnings are exposed to freight market volatility.
For shipowners, no fleet earns exactly the same revenue as the benchmark underlying an FFA contract due to differences in trading patterns, routes, vessel specifications, employment duration and fixture timing. In the Capesize freight market, for example, ships may operate on trans-Atlantic, trans-Pacific, front-haul and back-haul, each with distinct rate dynamics. When a shipowner hedges using a composite timecharter average, mismatches between these indices and their fleet's actual earnings arise. The traditional response is to treat this mismatch as a risk to be minimised. This view is useful but incomplete. Basis risk cannot be eliminated entirely, because physical fleet earnings are always more specific than the financial benchmark used to hedge them.
The central question is therefore not only "how do I hedge the market?" but "how can I make the basis more predictable and commercially favourable?" Basis risk is no longer simply an unwanted residual after hedging. Instead, it becomes something that can be actively shaped through operational choices and under certain conditions, turned into a source of profitability. Shipowner therefore reshape exposure through a different set of levers.
The first managerial lever is fleet and route diversification. A vessel or fleet concentrated on one route or region is highly exposed to the specific rate dynamics of that market. By operating vessels across multiple routes, shipowners can average out regional rate discrepancies. Adland and Jia (2017) Roar Adland and Haiying Jia (2017) found that increasing fleet size reduces basis risk through this diversification effect, with the strongest marginal benefit occurring up to around ten ships. Beyond that point, the benefit continues, but at a diminishing rate.
The second lever is timing diversification. If too many vessels are fixed at the same time, the entire fleet becomes exposed to the same market window. A sudden fall in spot rates may then affect a large share of earnings simultaneously. By staggering fixtures across different times and for varying durations, shipowners create a smoother income stream that is less susceptible to short-term market volatility. Individual voyages may still experience rate volatility, but the fleet as a whole becomes less sensitive to short-term index movements. Timing diversification, when managed deliberately, therefore becomes a source of income smoothing rather than merely a source of mismatch.
The third lever is contract diversification. Different forms of employment expose the shipowner to different types of freight risk. A purely spot-exposed fleet captures market upside but is highly volatile. A fleet locked into fixed-rate period employment has more predictable earnings but may miss upside when the market rises. Index-linked contracts move with the market but still create exposure to benchmark choice and settlement timing. By combining spot voyages, trip charters, period contracts, COAs and index-linked employment, shipowners can shape the earnings distribution of the fleet. FFA can then be layered on top of this contract mix to stabilise income, protect downside, or maintain selective exposure to upside opportunities.
The fourth lever is operational flexibility. A passive fleet simply accepts the basis produced by the market, while an active shipowner can influence realised earnings through operational choices. Shipowners can adjust vessel speeds, optimise fuel consumption, or reposition ships to routes with more favourable rates. Such proactive management allows shipowners to influence realised earnings relative to the hedged positions, turning the basis into opportunities.
Taken together, these levers show that basis risk should not be understood only as a residual risk left over after hedging. For shipowners, basis is embedded in the structure of fleet earnings. It reflects how vessels are deployed, how contracts are written, how fixtures are timed and how financial hedges are layered onto physical operations. Operational decisions and hedging decisions therefore become two sides of the same basis trading framework.
The 3x3 Trading Matrix
The previous sections showed the FFA are not isolated financial instruments. For freight traders, they help reshape commercial exposure; for shipowners, they interact with fleet structure, employment choices and operational flexibility to shape basis exposure. The Trading Matrix brings these two perspectives together by analysing interactions between three linked forms of exposure: Freight, Vessel and FFA.
The Trading Matrix lists the nine relationships in the 3x3 matrix and links each relative-value trade to its main price, location, calendar or quality risk. In this matrix, Freight refers to physical freight exposure, Vessel refers to vessel capacity or charter exposure and FFA refers to the paper exposure to a market index. Each presents different information in commodity supply chain: current logistics conditions, vessel availability and forward expectations.
The rows show what the trader sells, while the columns show what the trader buys. Each cell therefore represents a relative-value-trade. Rather than asking whether freight rates will rise or fall, the trader asks whether two related forms of freight exposure are correctly priced relative to one another. For example, the FFA for a particular route may appear expensive relative to the current physical freight market. When such pricing relationships deviate from normal market conditions, traders can buy the relatively undervalued exposure and sell the relatively overvalued one, expecting the relationship to move back towards its historical or economic equilibrium.
Constructing a strategy from the matrix involves three steps. First, the trader identifies a misalignment between two exposures. Second, the trader structures a position that buys the undervalued exposure and sells the overvalued exposure. Third, the trader manages the residual basis riskResidual basis riskThe risk remaining after hedging because the physical exposure and benchmark differ in route, timing, vessel characteristics, contract terms, operations or settlement.Open in terminology, liquidity risk and margin exposure. This final step is critical. A relative-value trade may be sound in principle but still fail if margin calls force early liquidation, or if the basis widens before it converges.
The value of the matrix lies in its ability to turn complex market interactions into a practical trading map. Rather than treating FFA, Freight and Vessel as separate markets, it shows how they interact. By focusing on relative values instead of absolute prices, the matrix allows traders to identify opportunities, structure hedges and manage risk across the full freight exposure landscape.
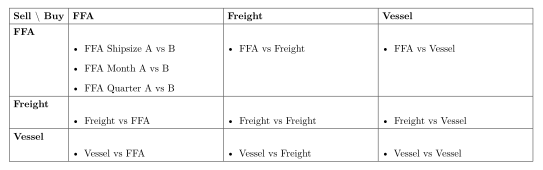
The Trading Matrix
Trading any of the combinations in the 3x3 matrix involves various types of risk, namely:
Price Risk: This occurs when the price movements of assets and their corresponding futures contracts diverge. For example, if an index is under- or overmarked compared to the spot market, it can lead to unexpected losses or gains.
Location Risk: Different market locations can exhibit varying levels of volatility. For instance, the Black Sea market in August might be more volatile than the global index, causing discrepancies in performance and risk exposure.
Calendar Risk: This risk arises when there is a mismatch between the settlement date of a futures contract and the execution date of the corresponding physical trade. For example, hedging with January contracts but needing to execute in December can create timing issues and potential financial mismatches.
Quality Risk: When the physical asset or cargo does not match the specifications of the futures contract quality risk emerges. An example is 38,000 DWT vessel with worse speed consumption than the 38,000 DWT Baltic Exchange index vessel, resulting in valuation errors.
Opportunity Cost in Freight Trading
Opportunity cost is central to freight trading because every commercial decision implies giving up another. In volatile freight markets, where rates adjust quickly and freight capacity is mobile for similar services, the trade-off's between choices is not simply between higher or lower rates, but between certainty and optionality. For example, when a shipowner is in the market, freight rates are transparent and competitors are quick to adjust their offerings as all shipowners are presumably offered the same freight rates. A shipowner must consider the opportunity cost of holding out for a higher rate versus accepting a lower but immediately available contract. The intensely competitive environment means that delays in decision-making can result in lost contracts to more agile competitors.
Baltic indices and FFA make these trade-off's measurable. The Baltic indices provide a benchmark for the prevailing physical market, while FFA provide a benchmark for future market expectations. By comparing a physical fixture with these market references, traders and shipowners can quantify the opportunity cost of accepting one commercial decision over another. This measure help make informed decisions about whether to accept a contract or wait for a better opportunity.
This perspective also links naturally to the Trading Matrix. Every relative-value trade represents an opportunity-cost decision. Buying one form of exposure—whether Freight, Vessel or FFA—means foregoing another. Strategic freight trading therefore extends beyond asking whether a freight rate is attractive. The more important question is whether it represents the best available use of capital and freight exposure relative to the alternatives offered by the market.
Carry the model forward.
Key Takeaways
Basis is the bridge between market analysis and trade execution.
Freight basis differs from classical commodity basis, but the logic of relative pricing remains the same.
Derivatives are useful when they are linked to a clear physical exposure or market view.
Good basis trading depends on understanding the mismatch between index exposure and physical reality.
Connection to the Next Chapter
Basis trading explains how relative value is monetised. The next chapter turns to formal risk measurement and pricing discipline, showing how risk appetite can be translated into a freight quote through a VaR-based framework.
Continue to VaR Based Pricing