Economics
Jump to a section3 sections in this chapter
Market Fundamentals
Assumptions
This part of the book introduces a small set of economic assumptions that we will use as a practical lens for freight trading inside commodity supply chains. The aim is not to prove any theory, but to offer readers a baseline for understanding freight and commodity markets. Further reading is recommended, and the bibliography of this book is a good place to start.
Scarcity and opportunity costOpportunity CostThe loss of potential gain from other alternatives when one alternative is chosen. Crucial in decision-making for resource allocation in agriculture and freight.Open in terminology rule logistics: Economics starts with scarcity: resources such as goods, time and skills are limited, and they have alternative uses. In freight, scarcity is physical and measurable, such as port capacity, vessel draft limits, storage space, and working capital. Every decision has an opportunity cost: a ship fixed Atlantic - Mediterranean cannot simultaneously serve US Gulf - Far East; cash tied up in one commodity cannot finance another. Freight rates are best understood as the price of allocating scarce freight capacity across competing cargoes, regions, time windows, and cargo owners.
Prices coordinate fragmented supply chains: Commodity supply chains are lengthy and fragmented: different actors, contracts and regions. There is no central planner. Coordination happens through prices - commodity prices and freight rates - which translate dispersed information into a signal. These price signals indicate to market participants where goods should move and whether they should be stored, processed or shipped. In this book, price is treated not merely as a transaction number, but as the signalling language of the supply chain that links decentralised decisions to a global pattern of trade.
Risk shapes decisions: Most market behaviour can be understood as incentive-driven decision-making under uncertainty. Profit is the reward for carrying risks, such as price, operational and counterparty risks. This helps explain why optionality has value, why spot tonnage can command a premium, why a tighter laycan costs money and why volatile routes tend to trade with a risk premium. In general, higher expected returns compensate for bearing higher risk Thomas Sowell (2014).
Freight markets adjust with delays: Economic models often assume fast and symmetric information, as well as instant adjustment to new information. Freight markets don't work that way. Market information arrives unevenly because participants have different networks, broker flows and visibility into cargo flows. At the same time, the physical freight system adjusts slowly: for instance ships take weeks to ballast in, ships can take months to reposition or existing contracts can lock capacity for the next quarter. Because prices can adjust immediately while logistics cannot, freight rates may temporarily deviate from fundamentals or long-term averages, especially under disruptions.
Regulations can distort freight markets: Freight markets do not consist only of private transactions. They operate within a regulatory framework set by international institutions and national authorities in areas such as safety, environmental protection and liability. Regulations therefore become part of the market environment that traders must price, anticipate and manage. They affect operating costs, feasible routes, port access and even which ships remain competitive after compliance costs. At the same time, direct government price controls can distort incentives and lead to surpluses, shortages and misallocation.
Taken together, these assumptions treat markets as the primary coordination mechanism—while recognising that freight is constrained by slow physical adjustment, uneven information, and a regulatory framework that protects shared resources. The rest of the chapter builds on this baseline to show how traders translate price signals, risk premia, and constraints into practical decisions.
Perfect Competition in Bulk Freight
Market structureMarket StructureMarket structure defines how a market is organised, including the number of buyers and sellers, product differentiation and entry barriers. It shapes competition, pricing power and efficiency within an industry.Open in terminology describes how competition is organised in an industry or a market: how many participants operate, how easy it is for new competitors to enter, how differentiated the product or service is and how much influence any one participant has over price Austan Goolsbee and Steven D. Levitt and Stephen J. Dubner (2019). Market structures range from perfect competition to monopoly:
Perfect Competition: Numerous firms offer identical services to customers who are price takers and no single company or customer can influence the market freight rates.
Monopolistic Competition: Many firms provide similar but differentiated services, perhaps through specialised routes or value-added services. This allows for some pricing power based on perceived differences.
Oligopoly: A few large firms dominate the market. High entry barriers, such as substantial capital investment and control over key routes, limit the number of competitors. These firms may engage in strategic pricing, but intense competition keeps rates largely determined by the market.
Duopoly: Only two firms control the market. While uncommon in global shipping, certain regional routes might exhibit duopolistic characteristics.
Monopoly: A single firm controls the entire market. In dry bulk freight, monopolies are rare due to international regulations and the vastness of global trade routes.
The bulk freight market is often well-approximated as perfect competition. This approximation is useful because it explains a central feature of freight: freight rates are shaped primarily by aggregated supply and demandSupply and demandA framework for analysing how planned quantities offered and requested interact with prices. In actual markets, clearing also depends on institutions, contracts, capacity constraints, expectations, information, regulation and bargaining, so the framework is an abstraction rather than a complete description.Open in terminology, rather than by any single participant. At the market level, four features support this framework:
Open Entry: Compared to asset-heavy industries, a freight trading desk can participate in freight trading without owning ships. New entrants can leverage existing infrastructure and technology without a significant upfront investment, although it requires serious working capital once the operation scales. As such, entry barriers are relatively low which allow new traders to enter the market with minimal obstacles. The ease of entry prevents the market dominance by any single entity, promoting competition and efficiency. After all, in freight trading, the casino is always open if you have just a little capital but make sure to count your cards.
Price Takers: In this market, individual traders are price takers, adopting the prevailing market rates rather than controlling them. The large number of participants and homogeneous services ensure that a single trader's transactions are too small to move the market price. Instead, freight rates are determined by aggregate supply and demand forces on a global scale.
Homogeneous Services: The freight service of moving bulk commodities from origin to destination involves standardised vessels and procedures, leading to services that are near-perfect substitutes. Customers perceive one trader's freight service as interchangeable with another's. Traders have to compete mainly on price and efficiency rather than unique features. This homogeneity requires a focus on cost management and operational excellence. In essence, when everyone offers the same carriage, success hinges on who can deliver it cheaper.
Intense Rivalry: Numerous traders compete fiercely for the same clients. This fierce competition drives innovation and relentless pursuit of marginal gains. Traders continuously optimise operations to outperform rivals, leading to lower costs and improved services for consumers. The competitive pressure ensures that no one rests on their laurels. As the saying goes; if you snooze, you lose, it is a race where everyone is sprinting to stay ahead.
Perfect competition is therefore a strong starting point for understanding why rates move quickly when the balance tightens and soften when it loosens. However, it is only an approximation rather than a full description. In practice, several frictions can cause short-term deviations from a simple aggregated supply-demand story:
Uneven information. Information asymmetry is prevalent. Some participants have access to better networks, proprietary data or superior analytics, while others update later. This lag in information dissemination can allow those with timely insights to capitalise on opportunities before others catch up. It does not remove competition, but leads to temporary deviations from market aggregation.
Fast decisions under uncertainty. Shipping opportunities can arise and vanish quickly due to factors like sudden demand spikes, geopolitical events, or port congestion. Participants must make swift decisions, often under pressure and with incomplete information. This haste can lead to errors in judgement, such as mispricing a freight rate or misjudging the profitability of a route.
Bounded rationality. Participants are not always perfectly rational profit maximisers Edward O. Thorp (2017). In the freight market, uncertainty, heuristics, emotions, and bias can shape choices: a shipowner might accept a lower rate due to fear of the vessel remaining idle, or a trader might overestimate demand based on rumours. These behaviours can lead to decisions that deviate from optimal economic models, creating inefficiencies that savvy participants can exploit.
A final issue matters for the broader supply chain context: while freight is often close to perfect competition, other links in the supply chain can be more concentrated or regulated. It means that commodities pass through multiple market structures on the journey from origin to the end consumer. This creates both a challenge and a unique opportunity for traders to find creative approaches. Traders who understand these mixed structural nuances can identify moments when the market behaves imperfectly, allowing them to capitalise on these discrepancies. We return to these deviations in more detail in the subsection on incentives and behaviour. For now, the competitive baseline gives us a clean foundation: at the aggregated level, freight prices are best understood as outcomes of market-wide balancing, not of individual control.
Buyers and Sellers
Having described the market structure that freight often resembles, we now examine freight buyers, freight sellers and the freight traders between them, who take price risk from both shipowners and charterers. Even in a highly competitive market, these actors differ in their constraints and objectives, so they do not value the same trade identically. Charterers typically seek to move goods efficiently on a given route and within a given time window, at the lowest feasible cost. Shipowners evaluate the same opportunity based on vessel availability, operating costs and the expected return from committing the ship over a longer period of time consisting of multiple voyages.
Economic logic of regional price gaps under logistics constraints and trader response. shows why regional freight spreads can persist under logistics constraints and how traders can respond to those spreads.
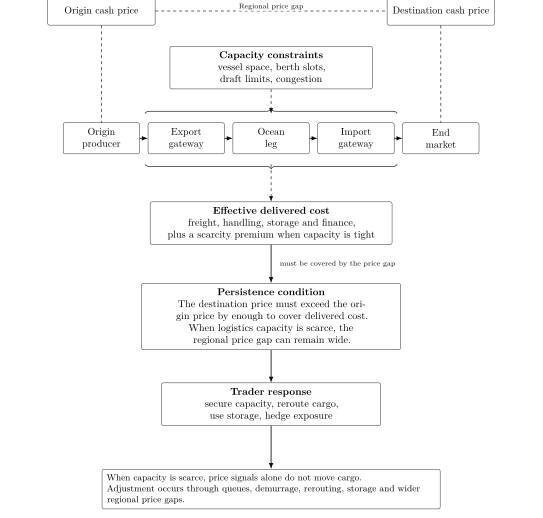
Economic logic of regional price gaps under logistics constraints and trader response.
This heterogeneity explains why there is no single freight rate at the transaction level. Some freight buyers are willing to pay higher rates for faster delivery or reliability, while others focus on minimising costs in exchange for longer transit times. Similarly, shipowners might prefer certain cargoes or routes that align with their strategic goals or offer better returns.
When analysing the freight market at an aggregated level, it becomes impractical to model every preference and constraint. We therefore use the concept of a "representative buyer and seller". This is not an assumption that participants are identical; rather, it is an assumption that their diverse behaviour can often be summarised in the aggregate for the purpose of explaining rate formation. When freight rates rise, the representative charterer tends to reassess their shipping needs, potentially reducing demand or seeking alternative routes. Concurrently, shipowners might allocate more vessels to high-demand regions to capitalise on higher rates. These systematic responses are the link between individual negotiation and the market-wide supply–demand balance.
This representative-agent lens allows classical economic theories to remain useful in freight. It facilitates the prediction of market trends, the setting of freight rates and an understanding of how supply and demand reach equilibrium. Individual deviations matter for execution and edge, but at the level of market structure and rate direction, aggregate behaviour is often enough to explain why prices move.
Price Fundamentals
Prices Coordinate Supply Chains
A trader rarely faces one price; they face a set of prices that jointly determine whether a transaction is feasible and profitable: the commodity price at origin and destination, the freight rate, storage and handling costs, financing costs, and exchange rates. These components fluctuate continuously and interact with each other. With that definition in place, prices coordinate fragmented supply chains through three practical channels: space, time and money. Each channel shapes where goods are sent, when they move and the financial terms under which the trade works.
Across space. Prices coordinate trade across regions. Traders compare the commodity price spread between locations relative to the costs of moving the goods. If the delivered spread covers the transport cost, trade flows are pulled toward the best route and origin; if it does not, the arbitrage is not possible and cargoes reroute or remain in the local market. In this sense, freight is not just a cost—it is the variable that often decides which supply chain segment connects to which.
Across time. Prices coordinate timing by rewarding either immediate movement or patience. The decision to ship now versus store and ship later is driven by the relationship between time spreads in the commodity price (spot versus forward values) and the cost of carry (storage, insurance, shrink, and financing). High carry costs push inventory out of storage and into the market; attractive forward spreads and cheap carry encourage holding inventory for later sale. This is how prices synchronise inventory behaviour with future demand.
Across money. Prices coordinate internationally by translating economics across currencies and balance sheets. Most commodity chains are international, so exchange rates and funding conditions change delivered competitiveness. A strengthening currency can make a country’s exports more expensive and less competitive; a weakening currency can improve export competitiveness but raise the local cost of imports and financing. Traders therefore manage “net” prices after foreign exchange, interest, and operational costs, often hedging currency exposure to protect margins.
The practical implication is that traders monitor a price system, not a single quote. A drop in freight can reopen an origin into a destination; an exchange rate move can flip which supplier is cheapest on a delivered basis; a change in carry can shift the choice from shipping to storing. Understanding how these linked prices transmit signals is essential for navigating freight and commodity trading.
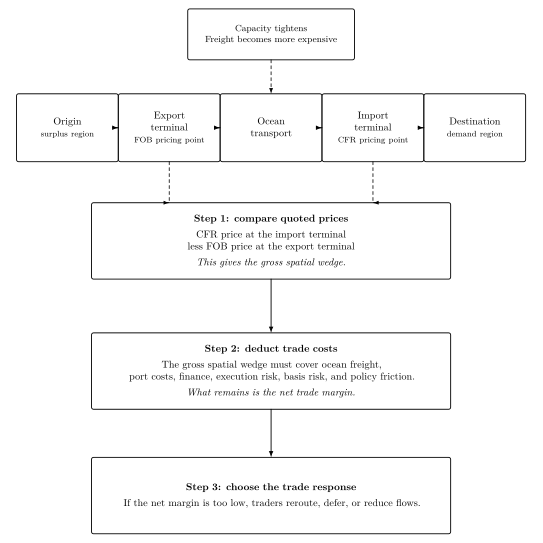
From Price Quotes to Trade Response.
A commodity trader may make an initial estimate of the implied freight rate by deducting a comparable FOB price from the CFR price. This spread is a useful starting point, provided that quality, shipment period, currency and unit are aligned, but it should not be interpreted as freight alone. It may also reflect loading and discharge rates and terms, financing, timing, basis effects, execution risk, the seller’s carriage and documentary obligations, the trader’s required margin and, where present, the value of embedded optionality. This book refers to treating the full FOB to CFR spread as pure freight as the “freight fallacy”. Optionality is discussed further in Space, Time and Form.
Prices as Emergent Outcomes of the System
In freight trading, price moves are rarely the result of individual intent by "greedy" shipowners or "exploitative" freight traders. More often, prices move because the market is continuously matching cargo needs with freight capacity under changing constraints. This can be understood through a systems-thinking lens. The freight market behaves as a complex adaptive system: many decentralised actors respond to local signals, their actions feed back into the market and the aggregate outcome (the freight rate) emerges without central control Thomas Y. Choi and Kevin J. Dooley and Manus Rungtusanatham (2001) Friedrich August von Hayek (1988). In this market, individual shipowners, charterers and brokers make decentralised decisions about cargoes, routes and rates based on their needs, expectations, constraints and opportunities. No central planner directs these choices, yet the system reallocates ships across regions as price signals change. The market “adapts” through feedback: rates attract ships, ship movements change local balances, and those balances feed back into rates.
A simple example is a surge in grain exports from the Black Sea region. Regional rates rise not because of the collusion of shipowners, but because effective supply is limited and the region must attract the marginal vessel: the ship that is currently best employed elsewhere. If the Black Sea needs to pull that marginal vessel away from an alternative market such as US Gulf, it must pay enough to compensate the owner's opportunity cost. The result is a higher Black Sea rate and, if the diverted vessel tightens US Gulf supply, potentially a higher US Gulf rate. These changes can then propagate into adjacent markets as positioning and substitution ripple through the network.
Seeing freight as a complex adaptive system shifts the focus from "who sets the rate?" to "what decision rules turn local signals into global outcomes?" From Price Quotes to Trade Response. is a representation of that rule at the trade level: traders translate a price signal into a trade flow decision. They compare CFR and FOB prices to measure the spatial wedge, deduct the trade costs (freight, ports, finance and risks) and then choose the trade response. When many decentralised actors apply this rule in parallel, they collectively change realised flows and vessel positioning and that new balance feeds directly into the next round of prices.
Another defining feature of complex systems is that small local changes can have non-linear effects because responses spread through multiple channels in the system. For example, a rise in fuel prices raises vessel operating and ballast costs. A deficit region may therefore need to pay higher freight rates to attract vessels from elsewhere. If its cargoes cannot support the higher cost, fewer vessels may reposition there and cargo demand may shift. Surplus regions can meanwhile face lower rates as owners discount to avoid a costly ballast voyage. The rate impact differs across routes, time windows and vessel sizes. In markets where cargo demand can adjust, higher total costs may reduce demand and soften rates. Where demand cannot adjust easily, the same shock can intensify scarcity and lift rates sharply. Freight prices are therefore network outcomes rather than simple reactions to individual variables.
Freight models aim to describe this behaviour, but models are necessarily simplified maps, not the territory. A useful model identifies the main state variables, constraints, and the feedback loops that transmit shocks across basins. For example, a Handysize model for the Black Sea should not only track local demand and competing cargoes, but also the channels through which the system adapts: fuel costs, congestion, and inflows/outflows of tonnage from neighbouring basins such as the Mediterranean. Used correctly, models help traders identify which constraint is binding, which feedback loop is dominant, and what the next re-balancing step is likely to be.
This framing sets up the next subsection on price formation: if rates are emergent outcomes of a complex adaptive system, then “formation” is best explained as the interaction of constraints, opportunity costs, and adjustment lags—rather than a single-driver story.
Freight rate formation
The economics of bulk grain transport operate in a way that often looks like a macro-level equilibrium, with supply and demand forces setting freight prices across regions and seasons. In this model, shipping rates fluctuate based on factors like fuel costs, demand shifts due to geopolitical tension, and weather patterns that affect harvests. For example, during times of grain abundance, such as bumper harvests in the United States or Brazil, shipping rates may increase due to increased competition (demand) for ships among exporters. In contrast, in periods of drought or crop failure, shipping rates may drop as there are fewer volumes to transport. In these cases, macro fundamentals explain where the market is headed.
Yet, the rate paid on a specific freight contract (fixture) is not determined by market fundamentals alone. Rather than assuming an "average global" trading pattern with a standard vessel specification, the heterogeneity of individual freight trading also matters. For instance, trade specific factors such as vessel-, route- and contract-specific determinants influence the freight rate of an individual contract Roar Adland and Fredrik Bjerknes and Christian Herje (2017). This is because an individual freight contract matches a particular cargo with a specific ship for a certain voyage agreed by the traders. The assumption of many buyers and sellers trading an identical service does not always hold in a micro-level market. Instead, the "relevant market" is the feasible set of ships for that cargo, route and timing. It depends on the supply and demand of that specific micro-environment: how many vessels are i) commercially open, ii) suitable for the cargo and parcel size, iii) able to meet the loading window and perform the voyage to the discharge port, and iv) acceptable to both charterers and shipowners under the contract terms.
In addition, market psychology and bargaining power between charterers and shipowners also affect the freight rate for each individual match Z. S. Zannetos (1966). Bulk commodity markets are often shaped by different incentives across supply chain participants, each influenced by their unique economic priorities. For instance, grain producers prioritise timely export of their harvests to avoid losses from spoilage and storage costs. Traders and commodity firms on the other hand leverage market information to buy low and sell high, focusing on price arbitrage and hedging strategies that allow them to manage the risks of price volatility. These incentives influence timing, optionality and urgency of freight trading, which can affect the freight price even when the overall market fundamentals are unchanged.
Game theory can provide insight into these competitive interactions in freight negotiation and trade timing, particularly in the grain market. For instance, traders and shipping firms might engage in a "sequential game" as they try to predict each other's actions in response to weather forecasts, geopolitical news, or shifts in demand. A shipowner might quote a higher freight rate in anticipation of a major export season, expecting grain traders to pay a premium to secure transport. Similarly, grain exporters may time their shipments to coincide with lower shipping rates or reduced competition for vessel space, capitalising on strategic knowledge of other players' actions. These examples highlight that freight prices are shaped both by market-level forces and by micro-level interactions, constraints and bargaining.
Elasticity
ElasticityElasticityA measure of how much the quantity demanded or supplied of a good changes when its price changes. Important for predicting market reactions to price shifts.Open in terminology is a measure of how much the quantity demanded or supplied of a good changes when its price changes. This is important for predicting market reactions to price shifts Austan Goolsbee and Steven D. Levitt and Stephen J. Dubner (2019). In freight markets, elasticity helps to answer two practical questions: i) demand elasticity: how much (and how fast) cargo demand changes when freight becomes more expensive; ii) supply elasticity: how much (and how fast) vessel supply can respond when rates rise. A useful starting point for understanding price elasticity is the time horizon. Both demand and supply in freight markets are typically inelastic in the short term; but the longer the time horizon, the more elastic they become because economic incentives can shape markets to find alternative solutions in the long run.
Demand elasticity When it comes to transporting essential goods like grains and other agricultural products, the sensitivity to price change is often limited in the short term. This is because freight demand is largely derived demand: it stems from underlying commodity flows that are determined by harvests, sales contracts and consumption needs rather than by freight rates themselves.
Once commodities reach the port, shippers commonly face two broad choices: ship or store and wait. This narrowed choice set makes demand for sea transport relatively price inelastic in the short term. Storage can be constrained and costly and may introduce quality and execution risk, so it is often an imperfect substitute for shipment. However, many dry bulk commodities can be stored, and delay is not inherently impossible.
Freight can be a modest component of the delivered price of some essential commodities, so small increases in freight rates may have little immediate effect on final consumption. However, for low value bulk cargoes or long routes, freight can be a material share of delivered cost and can change origin choice, shipment timing and traded volumes. Importers may therefore absorb small increases, switch origins, defer purchases or alter shipment timing, even when underlying consumption remains broadly stable.
That said, demand for freight service is rarely perfectly inelastic. Even when total annual import needs are stable, transport volumes can shift across origins, routes and timing. These adjustments typically matter more for traders and charterers than for end-customer demand. In practice, freight price changes more often reallocate flows and shift timing than alter final demand, especially over short horizons.
Supply elasticity On the supply side, freight markets are typically more inelastic in the short run because capacity is constrained by physical assets and operational bottlenecks. The availability of ships, port infrastructure and established trade routes means that capacity cannot be quickly adjusted in response to price changes. Over weeks and months, the active fleet is largely fixed and building new capacity takes years. This rigidity limits the industry's ability to respond swiftly to market fluctuations, maintaining the inelastic nature of supply.
Shipowners do have options to reduce effective supply in the short run, such as slow steaming, idling vessels or placing them in dry dock. These actions mainly affect effective capacity at the margin, but rarely enough to offset a major demand shock. Over longer horizons, supply becomes more elastic through redeployment between regions, reactivation or lay-up decisions, ordering or scrapping. This is why freight markets often exhibit pronounced cycles: demand can move more quickly, while supply adjusts slowly with lags. In short, freight demand for essential commodities is often inelastic in the short run, while freight supply is typically more inelastic.
Trader Fundamentals
Incentives and Behaviour
This section explores the logic beneath observed market behaviour: what shapes the actions of market participants. Standard microeconomic analysis often begins with individual agents who choose among alternatives subject to preferences and constraints. Simplified representative-agent models may impose common decision rules, but utility maximisation does not generally require homogeneous motivations or preferences.
Companies may pursue sustainability and social objectives as well as financial outcomes, while individuals may value social norms, altruism and sustainability. Such behaviour does not necessarily contradict utility maximisation at the individual level, because utility can include altruistic and non-financial preferences. It does show why models based only on financial self-interest may fail to explain observed behaviour. Marginal utility differs across individuals because of wealth, preferences and circumstances, which complicates aggregation Steve Keen (2011).
However, this framework often struggles when applied to society at large because individuals do not always act purely out of self-interest or rational calculation. Social norms, altruism and varying preferences introduce complexities that classical economics does not fully capture. For instance, individuals might engage in sustainable practices that do not necessarily maximise personal financial gain but contribute to social welfare Steve Keen (2011). These actions deviate from the classical assumption of utility maximisation based solely on personal benefit. Moreover, the concept of marginal utility, the added satisfaction from consuming an additional unit of a good, varies greatly among individuals due to differences in wealth, preferences and circumstances. When such variations are aggregated, predicting societal demand becomes challenging and the classical model's simplicity falls short.
At the macro level, the shipping industry is a setting where classical reasoning often performs better. Freight is a relatively standardised service and behaviour is mainly driven by efficiency and financial constraints. "Doing good" is rarely rewarded directly through pricing because there are limited mechanisms that pay market participants for altruistic outcomes.
Shipping also has a feature that reinforces this behaviour pattern. The demand for shipping services is driven by the need to move commodities efficiently from one location to another and each ship contributes capacity to fulfilling this demand. Unlike consumer goods, where marginal utility concerns satisfaction from consumption, a ship is a productive asset that adds transport capacity. The economic value of additional capacity is not constant; it depends strongly on vessel suitability, position and the current balance between vessel supply and cargo demand. This helps explain why small changes in effective supply or demand can cause large rate movements in a tight market but much smaller movements in a loose one.
Yet, anyone who has ever traded in freight markets knows a key nuance: the ship might be interchangeable, but the shipowner's will is not. Owners differ in risk appetite, liquidity needs, negotiation style and these differences show up most clearly in individual freight contracts. Charterers also differ in various manners, such as timing pressure and cargo constraints. This is where micro-level outcomes can deviate from a traditional classical model. These deviations are not a contradiction of supply and demand, but are the result of the stochastic nature of constraints and bargaining skills at the point of execution.
Opportunity Costs
Opportunity cost is the value of the next best alternative forgone. In freight trading, freight traders and shipowners constantly decide how to allocate limited resources, including vessels, capital and time. Every commercial choice reveals what decision makers value most at that moment, whether utilisation, optionality, risk exposure or a mix of all three. Seen this way, opportunity cost is a daily operating principle. It is the benchmark against which execution should be judged: was this the best available use of the ship, given what we knew and what we were trying to optimise?
Opportunity cost in vessel allocation. provides a practical framework for applying opportunity cost to vessel allocation. The process begins when a vessel becomes open. At that point, the relevant question is not "what rate can I get?", but "what options does this ship have from this position and time?" From there, the decision tree simplifies the choices into three paths: (i) fix a voyage now, (ii) ballast or wait to preserve flexibility, or (iii) take period employment to stabilise earnings.
The crucial step is the comparison box in the middle of the figure: evaluate each option on its commercial effect. The best option is the one that leaves the vessel in the strongest economic position once time, cost and risk are accounted for, not necessarily the one with the highest rate today. Once an option is chosen, the vessel is committed to that employment for the agreed period, so fixing now eliminates incompatible cargo options. Vessel employment is also a portfolio decision: the opportunity cost is the value of the best alternative forgone when one option is chosen over another.
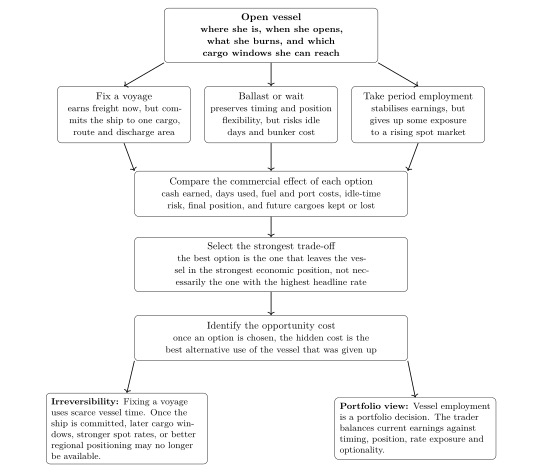
Opportunity cost in vessel allocation.
The three short examples below highlight one branch of the decision tree.
Example 1. A shipowner has a vessel underway with cargo loaded and a tight window before the next employment opportunity arises in the Pacific. The two main options are to sail faster (higher bunker burn) or slow steam (save bunkers but risk arriving too late). In the diagram’s terms, this is a timing-driven version of the “ballast/wait" branch: you are paying for optionality in time. The opportunity cost of slow steaming is the foregone earnings from missing the stronger employment; the opportunity cost of slow steaming is the net value of the stronger employment that may be missed. The additional bunker consumption is a direct cost of speeding up, while the opportunity cost of speeding up is the net value of the slow-steaming alternative forgone. The correct comparison is the net commercial effect of both paths, including direct costs, risks and the value of the rejected alternative.
Example 2. After discharge in the Mediterranean, the owner can pursue prompt European employment (fix now), or reposition to East Coast South America (ECSA) (ballast) where expected income is higher over a two-trip horizon but requires a longer ballast leg and greater timing risk. The “fix now” branch offers faster cashflow and lower uncertainty; the “ballast” branch offers higher expected value but higher exposure to the risk that the market shifts while you are out of position. For comparison, you must compare days used, ballast cost, likely idle time, expected revenues across the scenario, and the final position left after the trade. The opportunity cost of choosing Europe is the expected revenue (net of ballast and risk) you forgo by not entering ECSA; the opportunity cost of choosing ECSA is the safer, faster employment you give up—plus the possibility that you arrive into a softer market.
Example 3. If an owner expects the market to rise, they must choose between fixing period employment, remaining in the spot market or shaping exposure with FFAs. Fixing the vessel secures steadier income but limits upside if market rates rise. Selling FFA contracts against physical vessel exposure preserves flexibility in physical employment and reduces downside exposure, but limits upside if the market rises and introduces basis risk between physical earnings and the FFA settlement. Remaining spot leaves the owner fully exposed to market movements, for better or worse. The opportunity cost of each choice is the value of the best rejected alternative. The decision depends on the owner's market view and risk tolerance.
Opportunity cost in vessel allocation. shows a disciplined decision making model where a vessel decision should be judged against the best rejected alternative, not only against the visible profit on the chosen fixture. To evaluate opportunity cost, a trader needs a view on what the alternatives are likely to pay. Without that, trading becomes guesswork. Traders are, in essence, researchers who monetise their beliefs by putting a monetary value on them, and letting the market validate the beliefs.
Game Theory
Freight and commodity trading decisions are rarely made in isolation. They are shaped through strategic interactions, where one trader's choice depends on their own constraints, what they anticipate counterparties will do and how they can leverage their positions in the supply chain. Game theory contributes this strategic perspective to trader fundamentals Austan Goolsbee and Steven D. Levitt and Stephen J. Dubner (2019). Building on market and price fundamentals, game theory adds a strategic layer that helps traders understand how markets work under uneven information, time pressure and shifting bargaining power. In practice, the outcome "price" is the result of a negotiated package of terms.
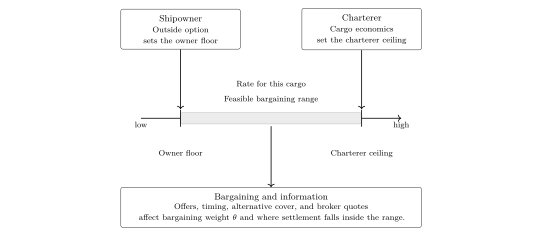
Stylised bargaining schematic for spot freight fixing.
Stylised bargaining schematic for spot freight fixing. captures the most common "game" in freight: bargaining in a spot fixture. Fixing does not occur at a single market point. Instead, it occurs inside a feasible bargaining range. The shipowner's outside option sets the floor, i.e. the lowest rate the owner can accept. The charterer's outside option sets the ceiling, i.e. the highest rate the charterer can pay before switching to an alternative. If the shipowner's alternative improves, the floor rises. If the charterer's alternatives improve, the ceiling falls. Either way, the feasible range moves and can tighten. Within that range, information and bargaining power determine where the deal lands.
A useful concept here is Nash equilibrium, which describes a set of strategies in which no player can improve their payoff by changing strategy unilaterally, given the strategies chosen by others. In a supply chain, a Nash equilibrium can be identified only after the relevant strategies and payoffs have been specified. In Stylised bargaining schematic for spot freight fixing., the owner's floor and the charterer's ceiling instead define the individually rational bargaining range. That range is not itself a Nash equilibrium, although a bargaining model with specified strategies and payoffs may have an equilibrium within it.
Game theory also illustrates the prisoner's dilemma, in which individually rational defection leaves both parties worse off than mutual cooperation. Repeated interaction, trust and enforceable agreements can support cooperation. The "sail fast, then wait" practice around tendering notice of readiness is better described as a contractual incentive or principal agent problem, unless the parties' strategies and payoffs are shown to satisfy the prisoner's dilemma structure. In that practice, the shipowner's incentive to tender notice early may differ from the shipper's or receiver's interest in reducing fuel use and waiting time.
Game theory therefore complements price fundamentals by explaining how freight is discovered through negotiation and interaction.
The Trading vs. Asset School
Facing the same market information, freight traders can develop very different ways of "seeing" the market. Two distinct approaches have emerged: a macro asset-oriented and a micro trading-oriented approach.
The asset-oriented school is defined by a macroeconomic approach, "asset heavy", emphasising global trends and long-term indicators such as global GDP growth, fleet utilisation and industry-wide metrics like scrapping rates, newbuild orders and fleet speed. Martin Stopford's work is a good example of this approach Martin Stopford (2009). The central question is where the shipping cycle is headed and what it implies for earnings, asset values and capacity over years rather than weeks.
In contrast, the trading-oriented school adopts a more micro-level trading focus, "asset light" TradeWinds News (2019), concentrating on spot trading, transaction execution and highly responsive, short-term opportunistic decision-making. In this school, feedback and success are measured in weeks or months rather than years. This shorter feedback loop creates a positive cycle in which performance is quickly evaluated, allowing companies to adjust their strategies based on immediate outcomes. By honing in on specific transactions and optimising each transaction, the trading-oriented approach fosters a culture of continuous improvement and agility but at the expense of long-term decision making. How freight control is separated from ship ownership. shows the interaction between the two schools. Owners often charter out to traders when they prefer stable income or lack cargo access, while traders charter in from owners to obtain capacity without tying up capital. Those charter contracts are the "bridge" between the two schools: transferring commercial control of capacity while leaving ownership unchanged. Shipowners focused on assets earn from hire and asset value, while outfits focused on trading earn from execution, timing, access, spreads and optionality.
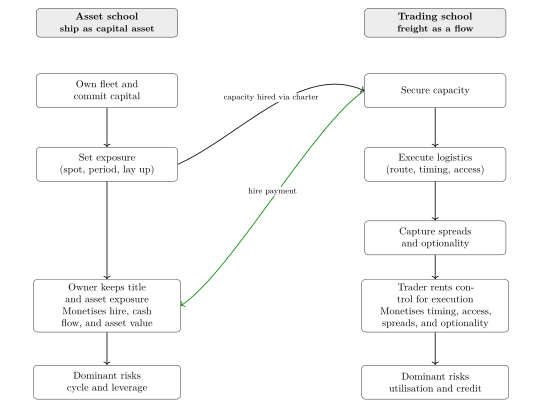
How freight control is separated from ship ownership.
While these distinctions are somewhat arbitrarily tied to national identities and countries, they reflect a broader divide in strategic orientation within one interconnected global shipping industry. Both aspects are important determinants of freight price, and traders must navigate both lenses: granular operational needs for a specific trade and broader macro fundamental trends. Therefore, these differences create an opportunity for traders to leverage insights from each approach, enhancing their adaptability in various market conditions.
Carry the model forward.
Key Takeaways
Economics provides the language for understanding freight price formation.
Prices are signals that coordinate scarce resources under uncertainty.
Opportunity cost is central to trading because every fixture implies the rejection of an alternative.
The same freight market can be viewed through both a trading lens and an asset-allocation lens.
Connection to the next chapter
This chapter establishes the economic language of the book and the markets. The next chapter converts that language into a practical market-accounting tool by introducing balance sheets as a supply-demand framework used by real life traders.
Continue to Balance Sheets